Observability for MCP servers
NewIntroducing SpanlyIntroducing Spanly: observability built for MCP→
Observability for MCP servers
Every tool call, every packet, any language. No code changes.
The dedicated layer for Model Context Protocol (MCP) traffic, alongside the Datadog, Sentry, or New Relic you already run. Built for engineering teams shipping MCP servers in production.
CLInpmpipAI
`$ curl -fsSL https://spanly.com/install.sh | sh`
Free tier, no credit card · Open-source SDK & CLI on GitHub
| 1 | initialize | \- | 15ms | | - | ---------- | ----------------- | ---- | | 2 | Tool | echo | 8ms | | 3 | Tool | non-exis…38317556 | 3ms | | 4 | Prompt | echo | 3ms | | 5 | Tool | non-exis…38313393 | 1ms |
No errors in this time range 🎉
0
requests
0
requests
0
requests
| Server Name | Requests | Tools | Prompts | Resources | Sessions | Errors | P50 | P95 | P99 | | ------------- | -------- | ----- | ------- | --------- | -------- | ------ | ---- | ----- | ------- | | mcp-prod-east | 14,210 | 12 | 4 | 9 | 412 | 18 | 24ms | 142ms | 418ms | | mcp-prod-west | 9,842 | 12 | 4 | 9 | 288 | 7 | 22ms | 128ms | 362ms | | mcp-edge-eu | 6,521 | 9 | 3 | 6 | 184 | 4 | 38ms | 168ms | 402ms | | mcp-staging | 2,103 | 9 | 3 | 6 | 61 | 28 | 52ms | 241ms | 1,284ms | | mcp-dev | 184 | 14 | 5 | 12 | 8 | 6 | 18ms | 92ms | 218ms | | mcp-internal | 42 | 4 | 1 | 2 | 3 | 0 | 12ms | 34ms | 88ms |
| Client Name | Connections | P50 | P95 | P99 | Last Seen | | ----------- | ----------- | ---- | ----- | ----- | --------- | | Claude Code | 82 | 24ms | 142ms | 418ms | just now | | Cursor | 61 | 32ms | 188ms | 521ms | 1m ago | | Codex CLI | 34 | 18ms | 92ms | 264ms | 2m ago | | Windsurf | 22 | 28ms | 161ms | 388ms | 7m ago | | Copilot | 18 | 38ms | 218ms | 612ms | 14m ago | | Zed | 7 | 52ms | 288ms | 824ms | 42m ago |
| Tool Name | Requests | Errors | P50 | P95 | P99 | Last Used | | ----------- | -------- | ------ | ----- | ----- | ----- | --------- | | web\_search | 4,210 | 12 | 88ms | 142ms | 418ms | 12s ago | | code\_exec | 2,841 | 4 | 142ms | 418ms | 982ms | 32s ago | | file\_read | 1,921 | 0 | 4ms | 12ms | 38ms | 1m ago | | db\_query | 814 | 2 | 28ms | 88ms | 184ms | 4m ago | | git\_diff | 312 | 0 | 18ms | 61ms | 142ms | 12m ago |
| Prompt Name | Requests | Errors | P50 | P95 | P99 | Last Used | | ----------------- | -------- | ------ | ---- | ---- | ----- | --------- | | summarize | 1,840 | 0 | 12ms | 38ms | 88ms | 22s ago | | extract\_entities | 962 | 0 | 8ms | 21ms | 52ms | 1m ago | | classify | 481 | 1 | 6ms | 14ms | 34ms | 3m ago | | search | 318 | 0 | 18ms | 52ms | 128ms | 8m ago |
| Resource URI | Requests | Errors | P50 | P95 | P99 | Last Used | | -------------------- | -------- | ------ | --- | ---- | ---- | --------- | | /docs/api | 2,104 | 0 | 2ms | 6ms | 18ms | just now | | /schema/openapi.json | 1,382 | 0 | 1ms | 4ms | 12ms | 12s ago | | /users/{id} | 712 | 3 | 4ms | 11ms | 28ms | 38s ago | | /orders | 284 | 0 | 6ms | 18ms | 42ms | 4m ago |
| Request ID | Server | Session ID | Method | Start Date | Duration | Input | Output | | ----------------- | ------------- | -------------- | ------------------------- | ---------- | -------- | ------ | ------- | | req\_8f3a912b07c2 | mcp-prod-east | sess\_8f3a912b | tools/call\>web\_search | 3s ago | 142ms | 1.2 KB | 4.8 KB | | req\_72c1ed40e391 | mcp-prod-east | sess\_8f3a912b | resources/read\>/docs/api | 8s ago | 6ms | 218 B | 12.4 KB | | req\_a14b09c2f8d1 | mcp-prod-west | sess\_72c1ed40 | prompts/get\>summarize | 12s ago | 38ms | 482 B | 1.8 KB | | req\_61f8c773aa20 | mcp-staging | sess\_a14b09c2 | tools/call\>code\_exec | 21s ago | 2,841ms | 4.2 KB | 128 B | | req\_d2e4a85117ff | mcp-edge-eu | sess\_61f8c773 | initialize | 34s ago | 15ms | 128 B | 482 B | | req\_9b1f37a8c402 | mcp-prod-east | sess\_8f3a912b | tools/list | 52s ago | 4ms | 64 B | 2.1 KB | | req\_4e07d92b1f88 | mcp-dev | sess\_d2e4a851 | tools/call\>db\_query | 1m ago | 88ms | 218 B | 3.4 KB | | req\_31ac0e4f7728 | mcp-prod-east | sess\_8f3a912b | resources/list | 2m ago | 9ms | 64 B | 1.2 KB |
| Session ID | Client | Server | Requests | Errors | Start Date | Duration | | -------------- | ----------- | ------------- | -------- | ------ | ---------- | -------- | | sess\_8f3a912b | Claude Code | mcp-prod-east | 412 | 0 | 4m ago | 12m 30s | | sess\_72c1ed40 | Cursor | mcp-prod-east | 218 | 2 | 9m ago | 8m 12s | | sess\_a14b09c2 | Codex CLI | mcp-prod-west | 581 | 0 | 18m ago | 22m 04s | | sess\_61f8c773 | Windsurf | mcp-edge-eu | 94 | 6 | 31m ago | 4m 47s | | sess\_d2e4a851 | Copilot | mcp-dev | 312 | 0 | 1h ago | 17m 21s |
| Error | Method | Server | Session ID | Time | Duration | | --------------- | --------------------------- | ------------- | -------------- | ------- | -------- | | Internal Error | tools/call\>code\_exec | mcp-staging | sess\_a14b09c2 | 21s ago | 2,841ms | | Invalid Params | tools/call\>db\_query | mcp-dev | sess\_d2e4a851 | 2m ago | 12ms | | Request Timeout | resources/read\>/users/{id} | mcp-edge-eu | sess\_61f8c773 | 12m ago | 30,000ms | | Rate Limited | prompts/get\>classify | mcp-prod-west | sess\_72c1ed40 | 38m ago | 8ms |
LogsLevelsLoggers
| Timestamp | Server | Session | Level | Logger | Size | | --------- | ------------- | -------------- | -------- | ----------------- | ------ | | 8s ago | mcp-prod-east | sess\_8f3a912b | info | mcp.server | 184 B | | 14s ago | mcp-prod-west | sess\_a14b09c2 | warning | tools.code\_exec | 412 B | | 38s ago | mcp-prod-east | sess\_72c1ed40 | error | auth.session | 1.2 KB | | 1m ago | mcp-edge-eu | sess\_61f8c773 | debug | transport.http | 92 B | | 2m ago | mcp-prod-east | sess\_8f3a912b | info | tools.web\_search | 256 B | | 4m ago | mcp-dev | sess\_d2e4a851 | notice | mcp.server | 218 B | | 6m ago | mcp-prod-west | sess\_a14b09c2 | critical | tools.code\_exec | 2.1 KB |
#### < 1ms
SDK overhead per request.
#### 99.9%
Uptime SLA for data ingestion.
#### 2 regions
US and EU, with full data residency.
#### APM-ready
Correlate any MCP exchange with its APM trace.
SDK and CLI source on GitHub, Apache 2.0.
Wrap your server with the CLI or drop in the SDK. No code changes required. Spanly captures the protocol-shaped detail your APM doesn't.
Founding Partner Program · First 10 production MCP teams. 50% off Business for 12 months, locked in.
WHY A DEDICATED LAYER
Don't APMs cover MCP now?
Sentry and New Relic ship MCP instrumentation in their SDKs. Datadog traces it from the client side. That works if your server runs a supported language and you can change its code.
Spanly works at the protocol level. An on-call engineer reads a failing tool call without piecing it together from spans.
Any languageNo code changesFull payloads
tools/call
error412ms
Request
{
"jsonrpc": "2.0",
"id": 47,
"method": "tools/call",
"params": {
"name": "create\_invoice",
"arguments": {
"amount": 4200,
"currency": "USD$"
}
}
}
Response
{
"jsonrpc": "2.0",
"id": 47,
"error": {
"code": \-32602,
"message": "currency must be ISO 4217"
}
}
server billing-mcp·client claude-desktop·v2.3.1
Approach
Your APM
Vendor SDK inside your server process
Spanly
Transport level: wrap the process or proxy the traffic
Languages
Your APM
Node and Python agents
Spanly
Any language, stdio or HTTP, zero code changes
Payloads
Your APM
Tool calls as spans, against your tracing quota
Spanly
Full JSON-RPC packets: arguments, results, errors, timings
Third-party
Your APM
Needs code you can instrument
Spanly
Proxy mode covers servers you don’t own
Tenancy
Your APM
Tags you wire up yourself
Spanly
Per-client and per-tenant views via headers or JWT claims
Axis
APM MCP add-ons
Spanly
Approach
Vendor SDK inside your server process
Transport level: wrap the process or proxy the traffic
Languages
Node and Python agents
Any language, stdio or HTTP, zero code changes
Payloads
Tool calls as spans, against your tracing quota
Full JSON-RPC packets: arguments, results, errors, timings
Third-party
Needs code you can instrument
Proxy mode covers servers you don’t own
Tenancy
Tags you wire up yourself
Per-client and per-tenant views via headers or JWT claims
We complement your existing stack. We don't replace it. Spanly is additive. Keep sending HTTP and infra telemetry to your APM, and send MCP-shaped traffic here. What is MCP observability?
What does Spanly monitor?
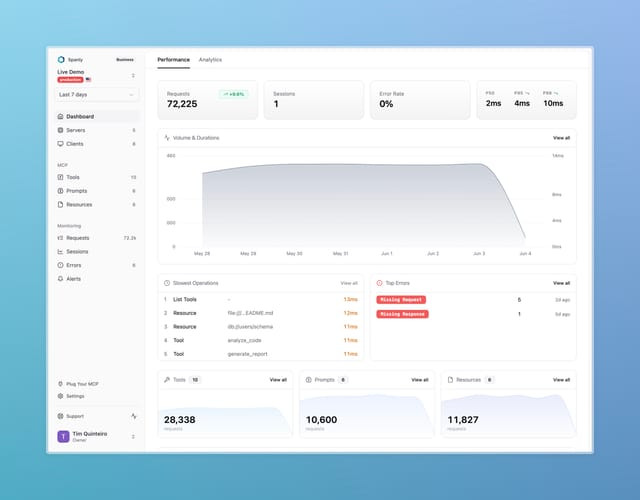
From real-time tracing to error tracking, Spanly captures every MCP request your server handles, from `tools/call` to resource reads.Every MCP request your server handles, from `tools/call` to resource reads.
| initialize | 30 | 2 | 1ms | 2ms | 15ms | | -------------- | -- | - | --- | --- | ---- | | tools/call | 10 | 4 | 1ms | 6ms | 8ms | | resources/read | 6 | 2 | 1ms | 1ms | 1ms |
Real-time Traces
Visualize every request and response between clients and servers with detailed timing breakdowns. Drill into a single MCP call to see the full payload, the server that handled it, and where the milliseconds went.
Error Rate
0.42%
−12%
Affected Servers
3
+1
| Error Code | Count | Last Occurred | | ----------------- | ----- | ------------- | | Invalid Params | 24 | 2m ago | | Internal Error | 11 | 14m ago | | Request Timeout | 7 | 1h ago | | Method Not Found | 5 | 3h ago | | Connection Closed | 3 | 8h ago |
Error Tracking
Catch errors before your users do. Recurring failures show up once, not a thousand times. Track error codes, frequencies, and stack traces across every server and client, all grouped automatically.
Slowest operations
p50p95p99
Ttools/call: web\_search
58380890
Ttools/call: code\_exec
210480720
Rresources/read: /docs/api
76280540
Pprompts/get: search
22210320
Ttools/call: file\_read
82140180
Minitialize
184265
Performance Metrics
Monitor request durations, identify bottlenecks, and track performance trends over time. p50, p95, p99 broken down by server and tool, so you can tell a single slow tool apart from a regressing deployment.
Cursor
14.1k+9%
Error rate0.18%
Codex CLI
9.7k+14%
Error rate0.21%
Claude Code
18.2k+28%
Error rate0.09%
Windsurf
6.3k+41%
Error rate0.27%
Copilot
11.5k−3%
Error rate0.14%
Cline
4.8k+22%
Error rate0.33%
Zed
3.2k+52%
Error rate0.41%
Continue
2.1k+7%
Error rate0.19%
Analytics
Aggregate usage across servers and clients to spot trends and tune performance. See which prompts, tools, and resources are actually getting used, and which ones aren't earning their keep.
Distinct versions over time
1.3.71.4.21.5.0
deploy
VersionConnectionsp50p95p99
v1.3.7
142
38110180
v1.4.2
891
42128210
v1.5.0
318
86340620
Catch the bad deploy
Every request is tagged with the server and client version that handled it. Watch p50/p95/p99 split out by version, see the new release ride in alongside the old, and pinpoint the exact rollout that started the regression.
DATA RESIDENCY
Your data, in your region
Pick US or EU when you create a project. Telemetry stays there. GDPR-friendly by design, with full data residency.
2 regions
US and EU ingest endpoints. Pick one per project; data never leaves it.
1 jurisdiction
EU customers keep all telemetry inside the EU. GDPR-ready, no US-side replication.
0 cross-region copies
Daily backups live in the same region as your live data. Never replicated elsewhere.
Operate at scale
What do you ship to the on-call team?
Live status, alerts, session traces, and logs from your MCP server. Built for the team room, the pager, and the post-mortem.
Status board
Built for the office TV
Pin always-on status boards to any screen. Full-screen, auto-refresh, no chrome.
Auto-refresh · 30sLive
Uptime
99.97%
p95
142ms
Errors
18
Open incidents
2
Alerts
Alerts, before users notice
Thresholds on error rate, p95/p99, or traffic. Scoped to any server, client, or tool. Routed to email, Slack, and signed webhooks.
Triggered just now
p99 latency exceeded threshold on mcp-prod-east
p99 > 500ms for 5m·just now
Error rate spiked on tool code\_exec
errors > 2% for 10m·6m ago
Traffic dropped 40% on client Cursor
volume drop > 30% for 15m·24m ago
Sessions
Trace every session, end to end
Group requests by session to see the full arc of an interaction. Every tool call, every error, every retry.
Real-time
- sess\_72c1ed40· started 12m ago12m 04s 40 req·2 err
- sess\_8a39f10c· started 3m ago3m 22s 18 req·0 err
- sess\_5d20b4ee· ended 2h ago41m 18s 112 req·5 err
- sess\_19b7cc28· ended 5h ago1m 02s 7 req·0 err
- 12:42:08infomcp.server client Cursor connected (protocol 2025-06-18)
- 12:41:55warningmcp.tools.code\_exec sandbox cold-start exceeded 800ms
- 12:39:21errormcp.transport stream closed unexpectedly mid-response
- 12:38:02debugmcp.resources
Logs
Logs, alongside your requests
Capture every notifications/message your MCP server emits. Filter by level or logger, jump from any log line straight to the session and request that produced it.
How fast can you be live?
Drop the SDK into your MCP server. No schema to maintain, no agent process, no rebuild.
For your server
Instrument your MCP server
Drop the SDK into your TypeScript or Python server, wrap any binary with the CLI, or ship Spanly as a Docker sidecar. Every prompt, tool call, and resource gets traced.
Copy for AI
TypeScriptPythonCLIDocker
Install
$ npm install @spanly/sdkCopy
Usespanly-setup.ts
import { SpanlyClient } from "@spanly/sdk"const spanly = new SpanlyClient({
apiKey: process.env.SPANLY_API_KEY,
})
spanly.monitor(mcpServer)
Copy
Also
Query Spanly from your editor
Spanly ships its own MCP server. Point Claude Code, Cursor, or any MCP client at it to search traces and triage errors without leaving your IDE. Search traces and triage errors from your IDE.
ClaudeCodexCursorVSCodeWindsurfZedOther
$ claude mcp add --transport http spanly https://mcp.spanly.comCopy

Start monitoring your MCP servers
Engineering teams: add the MCP layer to your observability stack in under 5 minutes.