LayerProof Bristol

LayerProof Bristol
Agentic reports your clients want to read
Interactive Q1 Business Review Q1-data.csv Q1-data.csv
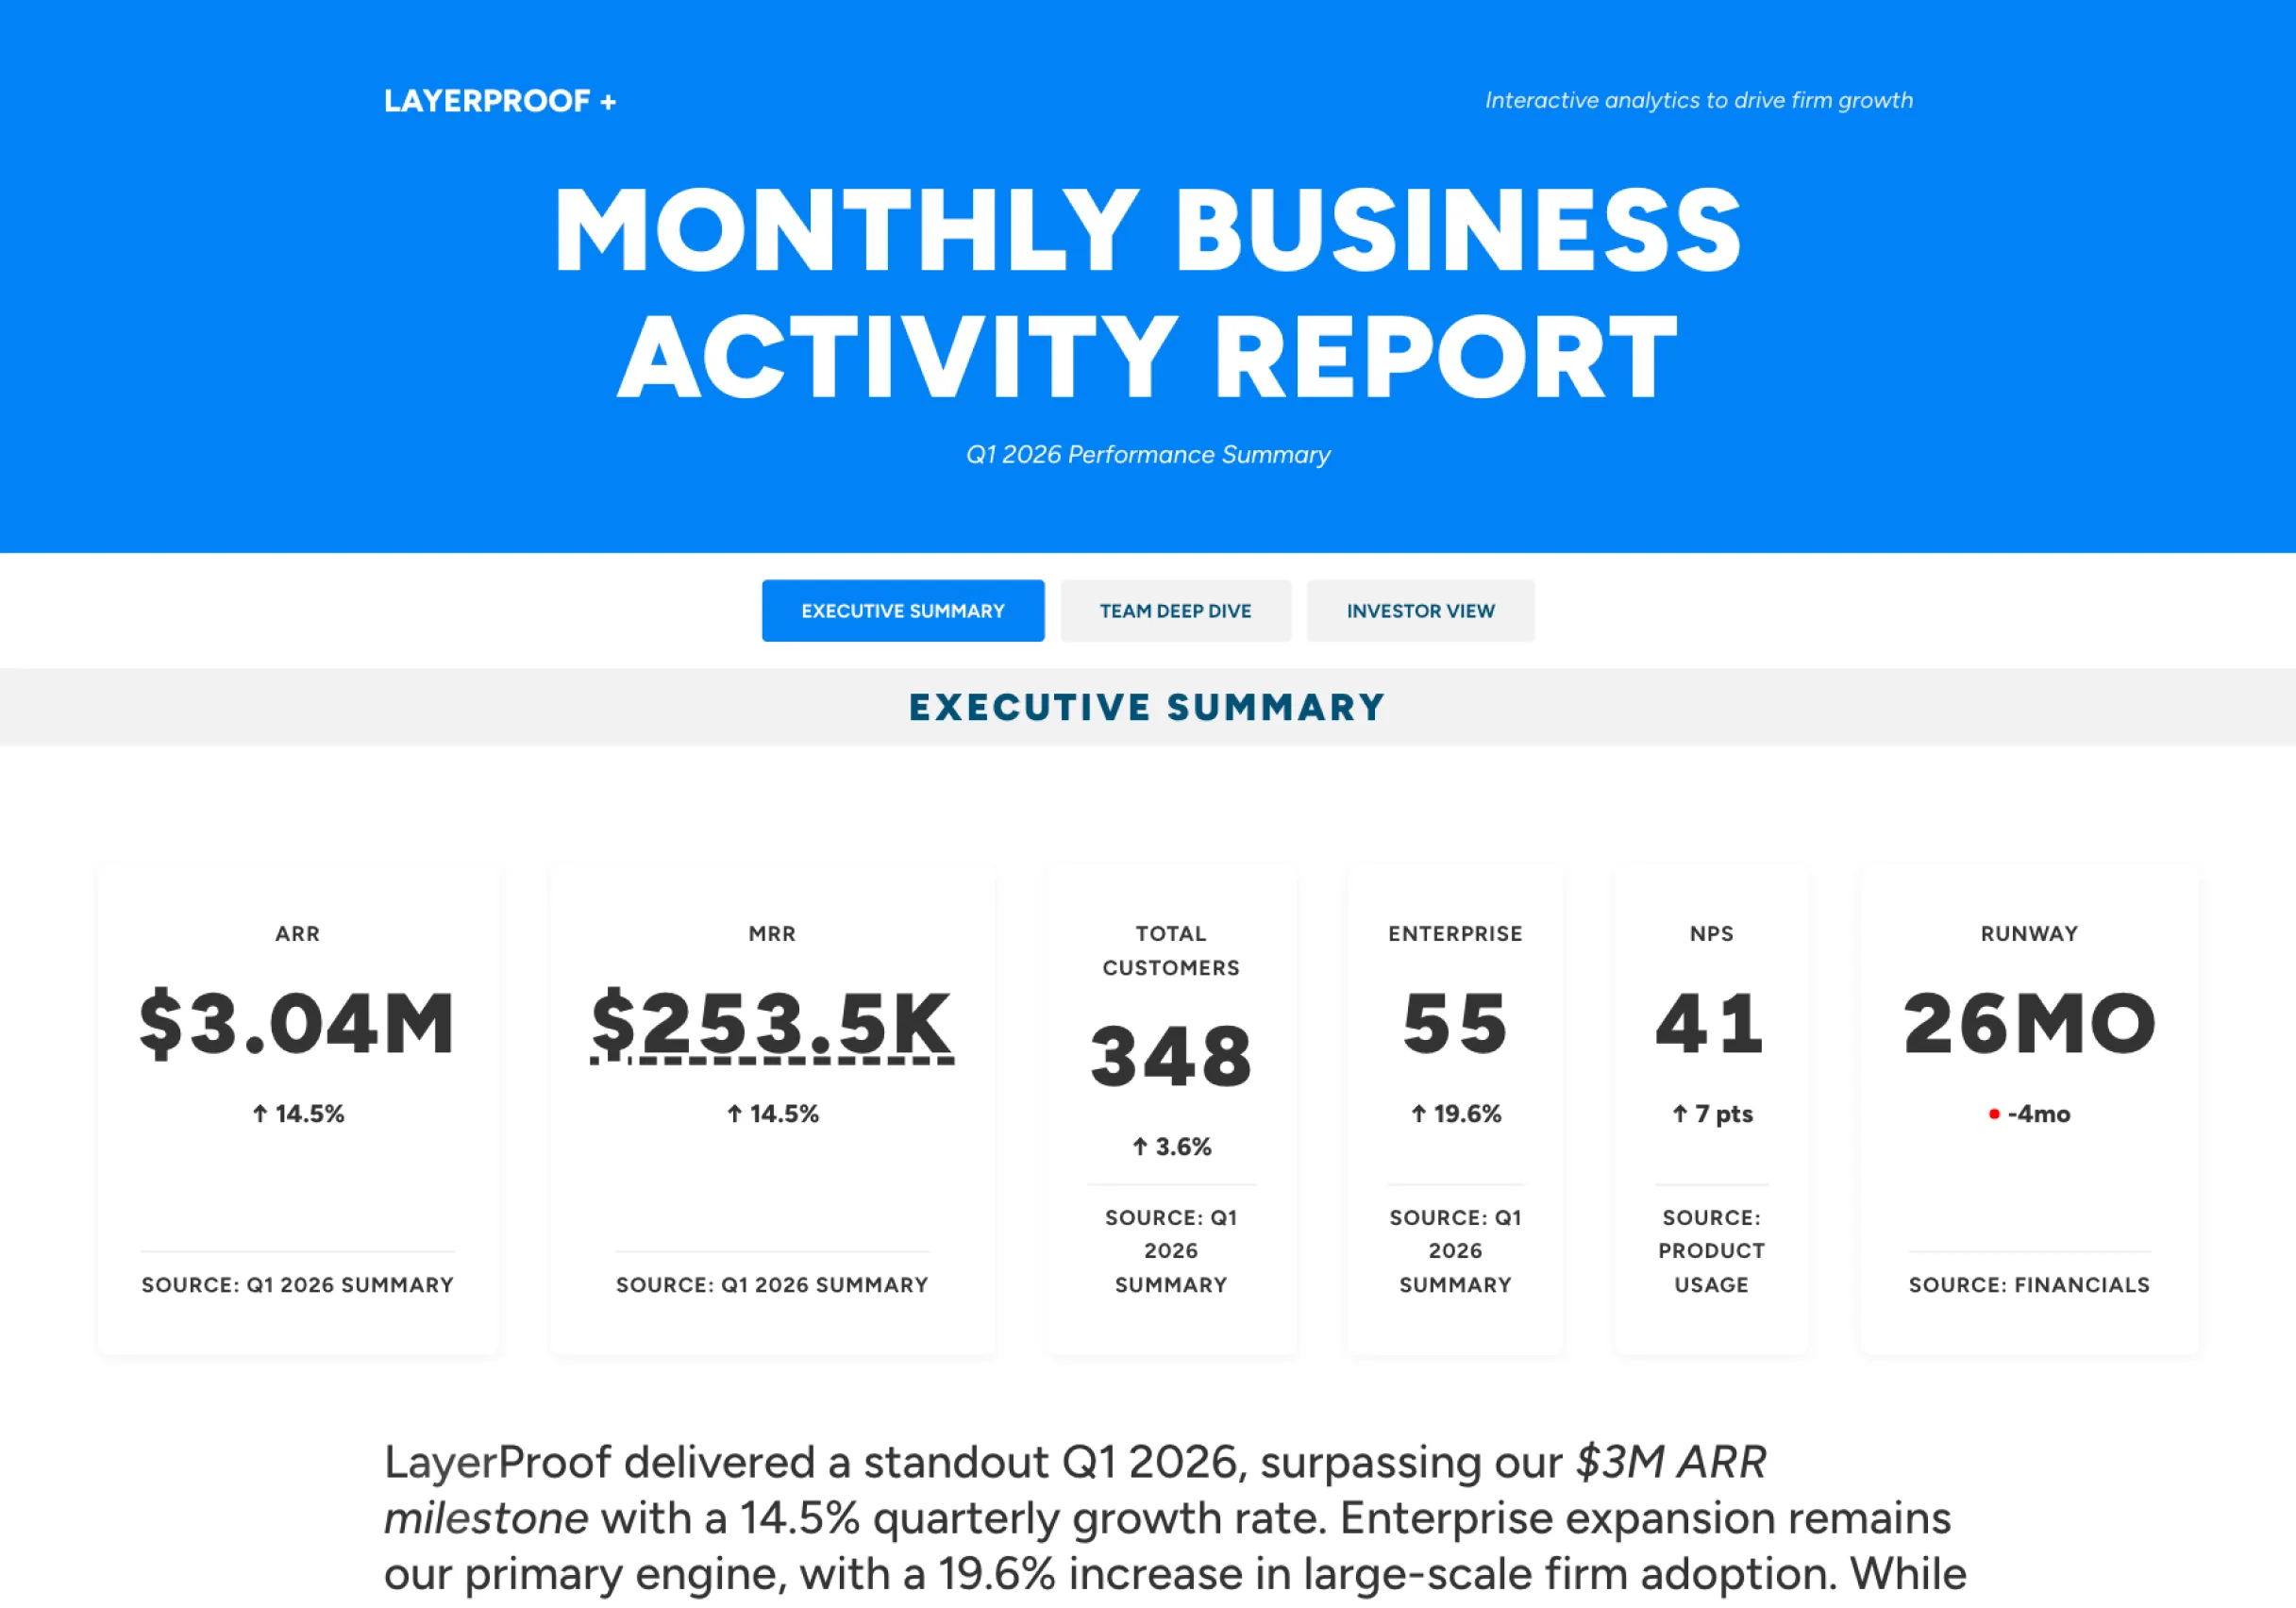
Q1 2026 Business Review
Jan – Mar 2026 ARR $3.04M · +14.5% QoQ NPS 44 · All-time high 27 mo runway
Archway · Q1 2026
Q1 2026 · Jan–Mar
The numbers.
Target: $2,900,000 ✓ Hit — $142K above target (+4.9%)
ARR
$3.04M
↑ +14.5% vs Q4
Source: Q1 Summary · Row 1
Target: $241,700 ✓ Hit — $11,800 above target (+4.9%)
MRR
$253.5K
↑ +14.5% vs Q4
Source: Revenue Sheet · Mar 2026
Target: 345 customers ✓ Hit — 3 above target (+0.9%)
Total Customers
348
↑ +3.6% vs Q4
Source: Q1 Summary · Row 3
Target: 52 Enterprise ✓ Hit — 3 above target (+5.8%)
Enterprise Customers
55
↑ +19.6% vs Q4
Source: Q1 Summary · Row 4
Target: 40 ✓ Hit — 4 points above target
NPS Score
44
↑ +10 pts vs Q4
Source: Product Usage · Mar 2026
Target: 24 months ✓ Hit — 3 months above target
Cash Runway
27 mo
↑ +3 vs target
Source: Financials · Mar 2026
Revenue Mechanics
MRR waterfall.
New / Expansion / Churned / Net New MRR
Monthly breakdown, Oct 2025 → Mar 2026. Hover bars for exact values.
Growth Trajectory
ARR — actual and projected.
ARR · Apr 2025 → Mar 2026 + Projected → Dec 2026
Projected at current MoM growth rate (\~3.2%). Hover for exact values.
Q1-data.csv

Processes visuals faster than text
Processes visuals 60,000x Faster than text
Processes visuals 60,000x Faster than text

A normal report
- × Static charts + tables
- × One view for everyone
- × Reader mostly scrolls/skims
- × Trust is assumed ("take our word")
- × Updates = re-export + resend
- ✓ Clickable exploration
- ✓ Personalized depth
- ✓ More convincing story
- ✓ Proves the numbers
- ✓ Always update
 Step 1
 Step 2
 Step 3
 Step 4
- ### Ask for a report, see it instantly Bristol turns what you ask into real ready-to-use HTML. Not templates. Start now
- ### Visual editor for quick fixes Click directly into text, charts, or layout. Or just type what you want changed. Start now
- ### Custom functions on request Filters, comparisons, interactive timelines, etc. If it's HTML, the agent can add it. Start now Filter
- ### Data storytelling proves itself Interactive charts, drillable sections, and traceable numbers make every report easier to trust. Start now
-
 Kraft Co-write insightful long form content
-
 Matte 2.0 Create scroll-stopping Social Media posts
-
 Chromo AI slides you can stand behind
-
 Washi Automate visual creation
-
 Vellum One canvas for every image asset you need

Bristol reports
How it works?
Drop your data
Files, URLs, pasted information. Just drop in what you want to visualize.Shape it by chatting
Adjust charts, change tone, swap angles. Make it interactive without skills needed.Direct visual edit
Adjust charts, change tone, make it interactive.One click to publish
One click. And it is live to your audiences.POWER YOU ACTUALLY NEED

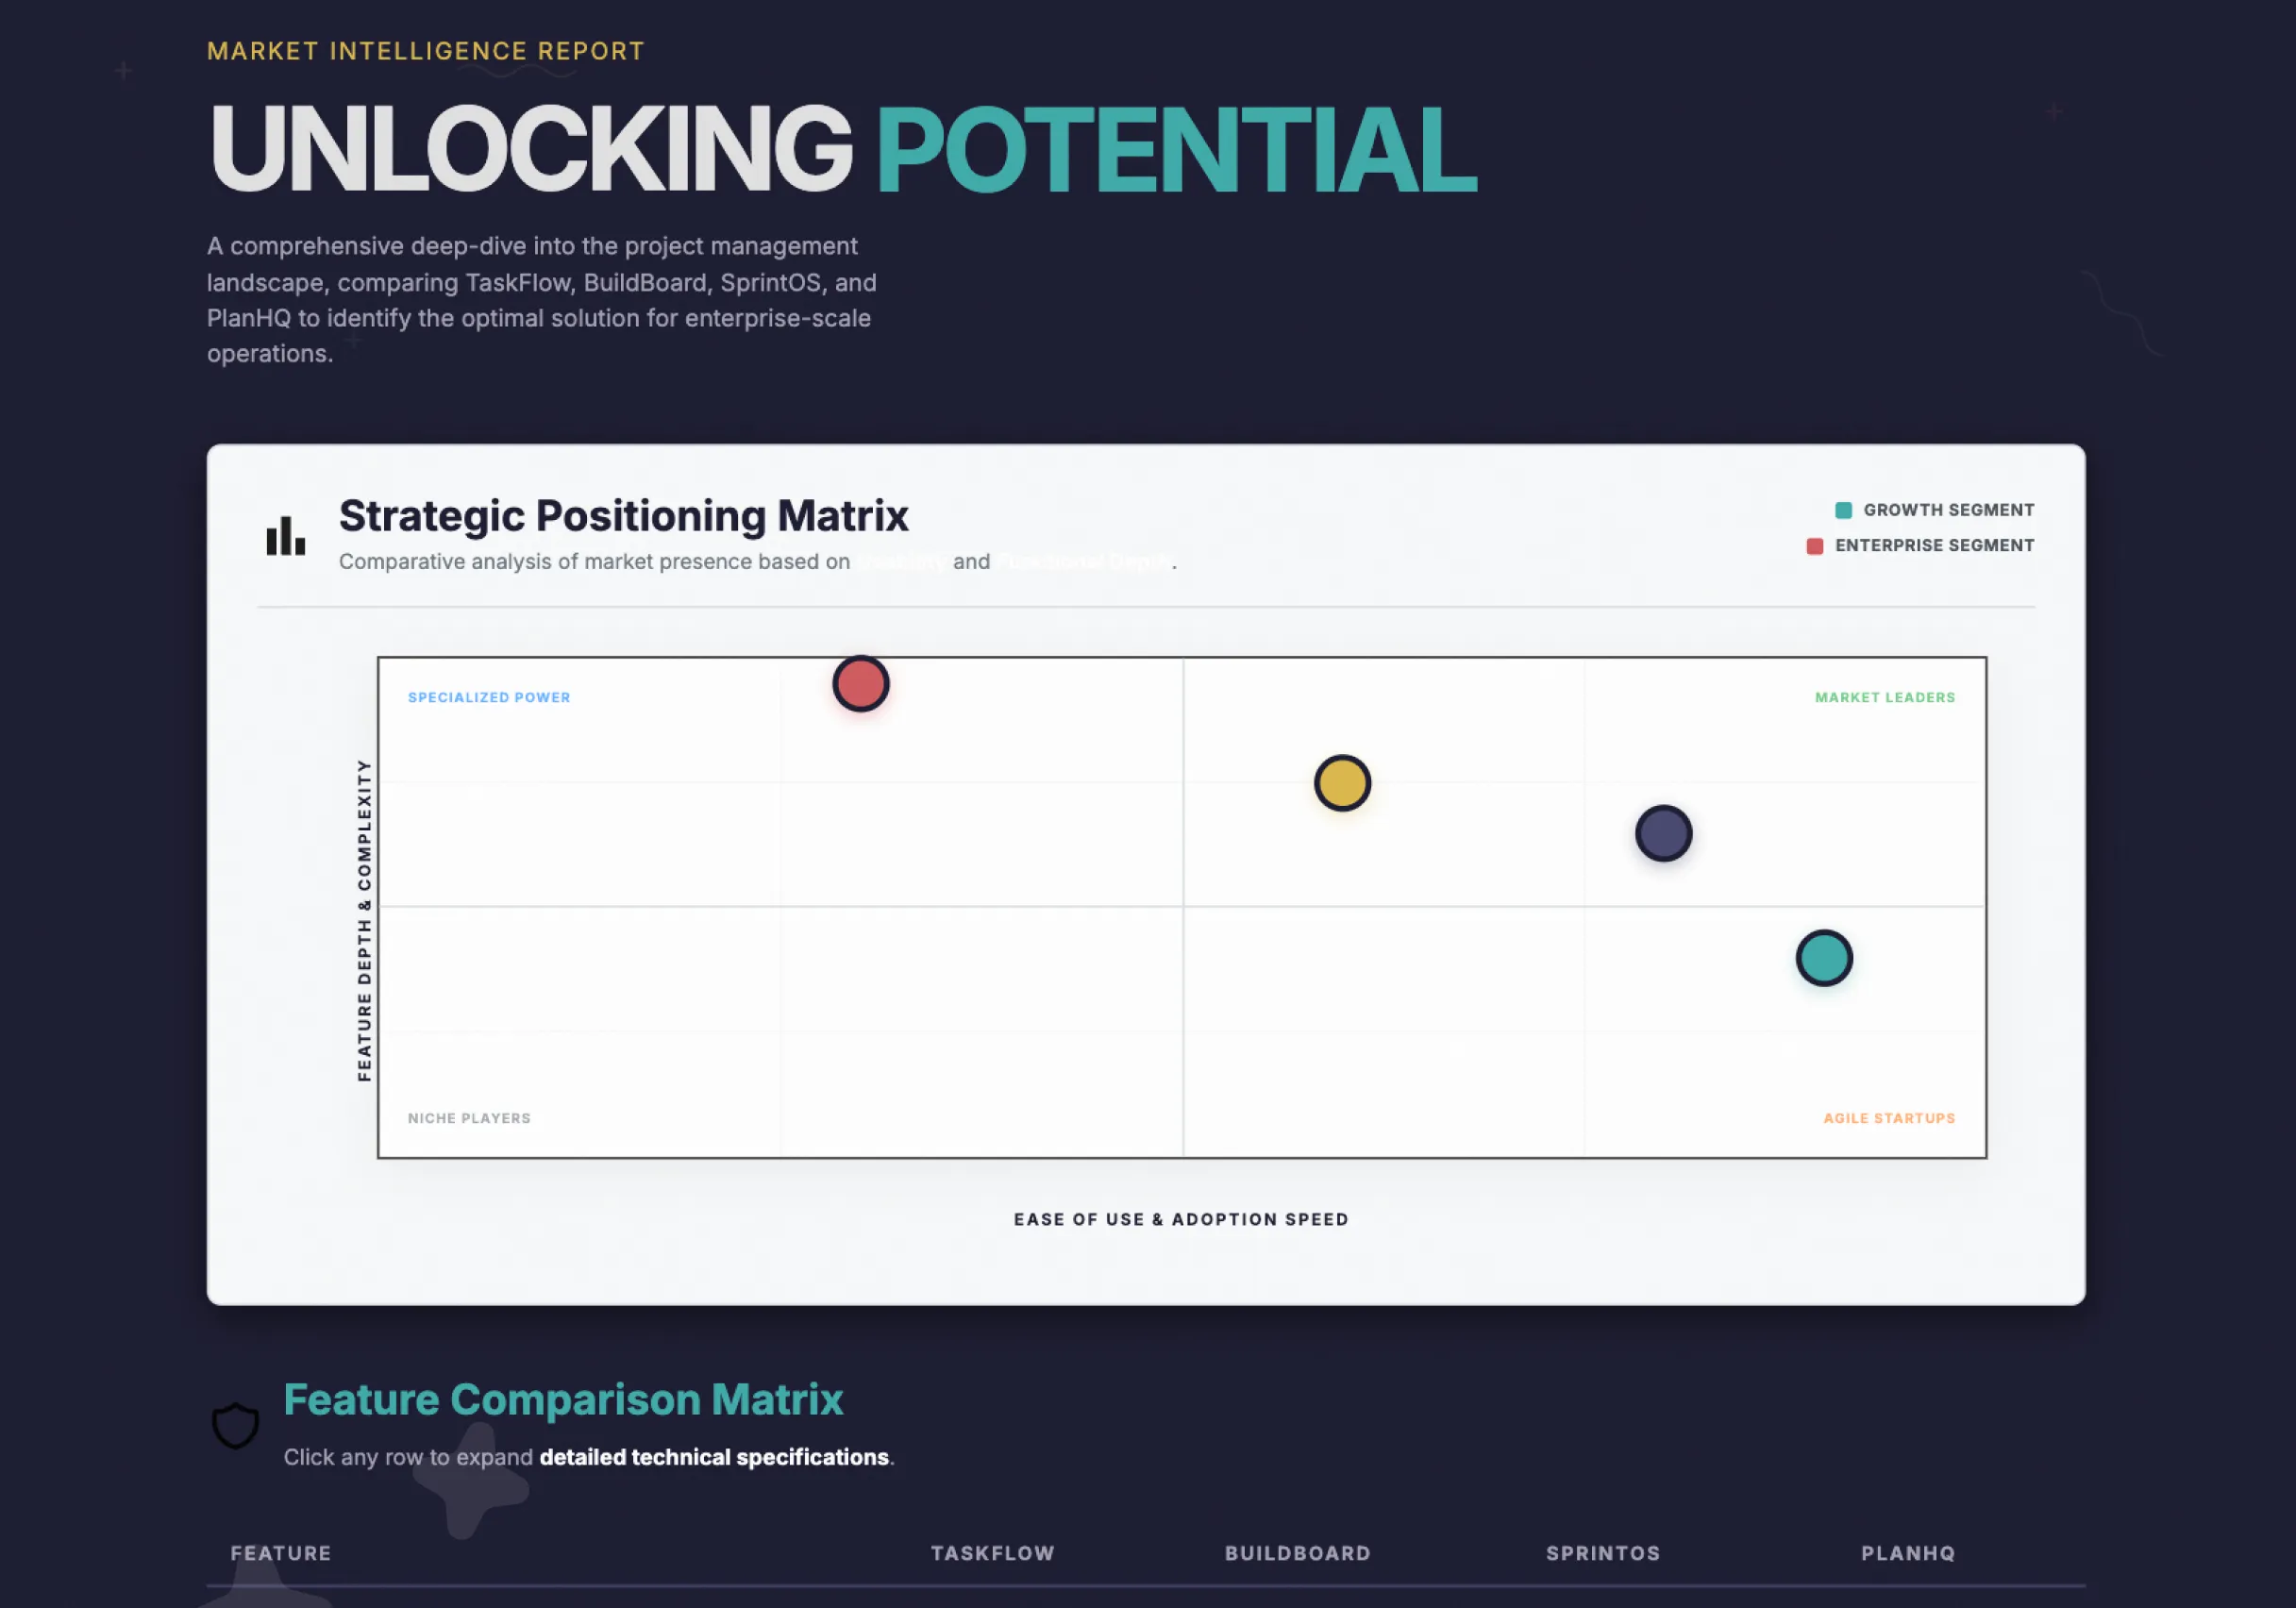
 A deep dive into the LayerProof ecosystem. Growth is driven by a small power-user cohort; the priority is bridging the gap between discovery and activation.


Request
What you actually wantBusiness Review Landscape Analysis Learning Finance Recruitment
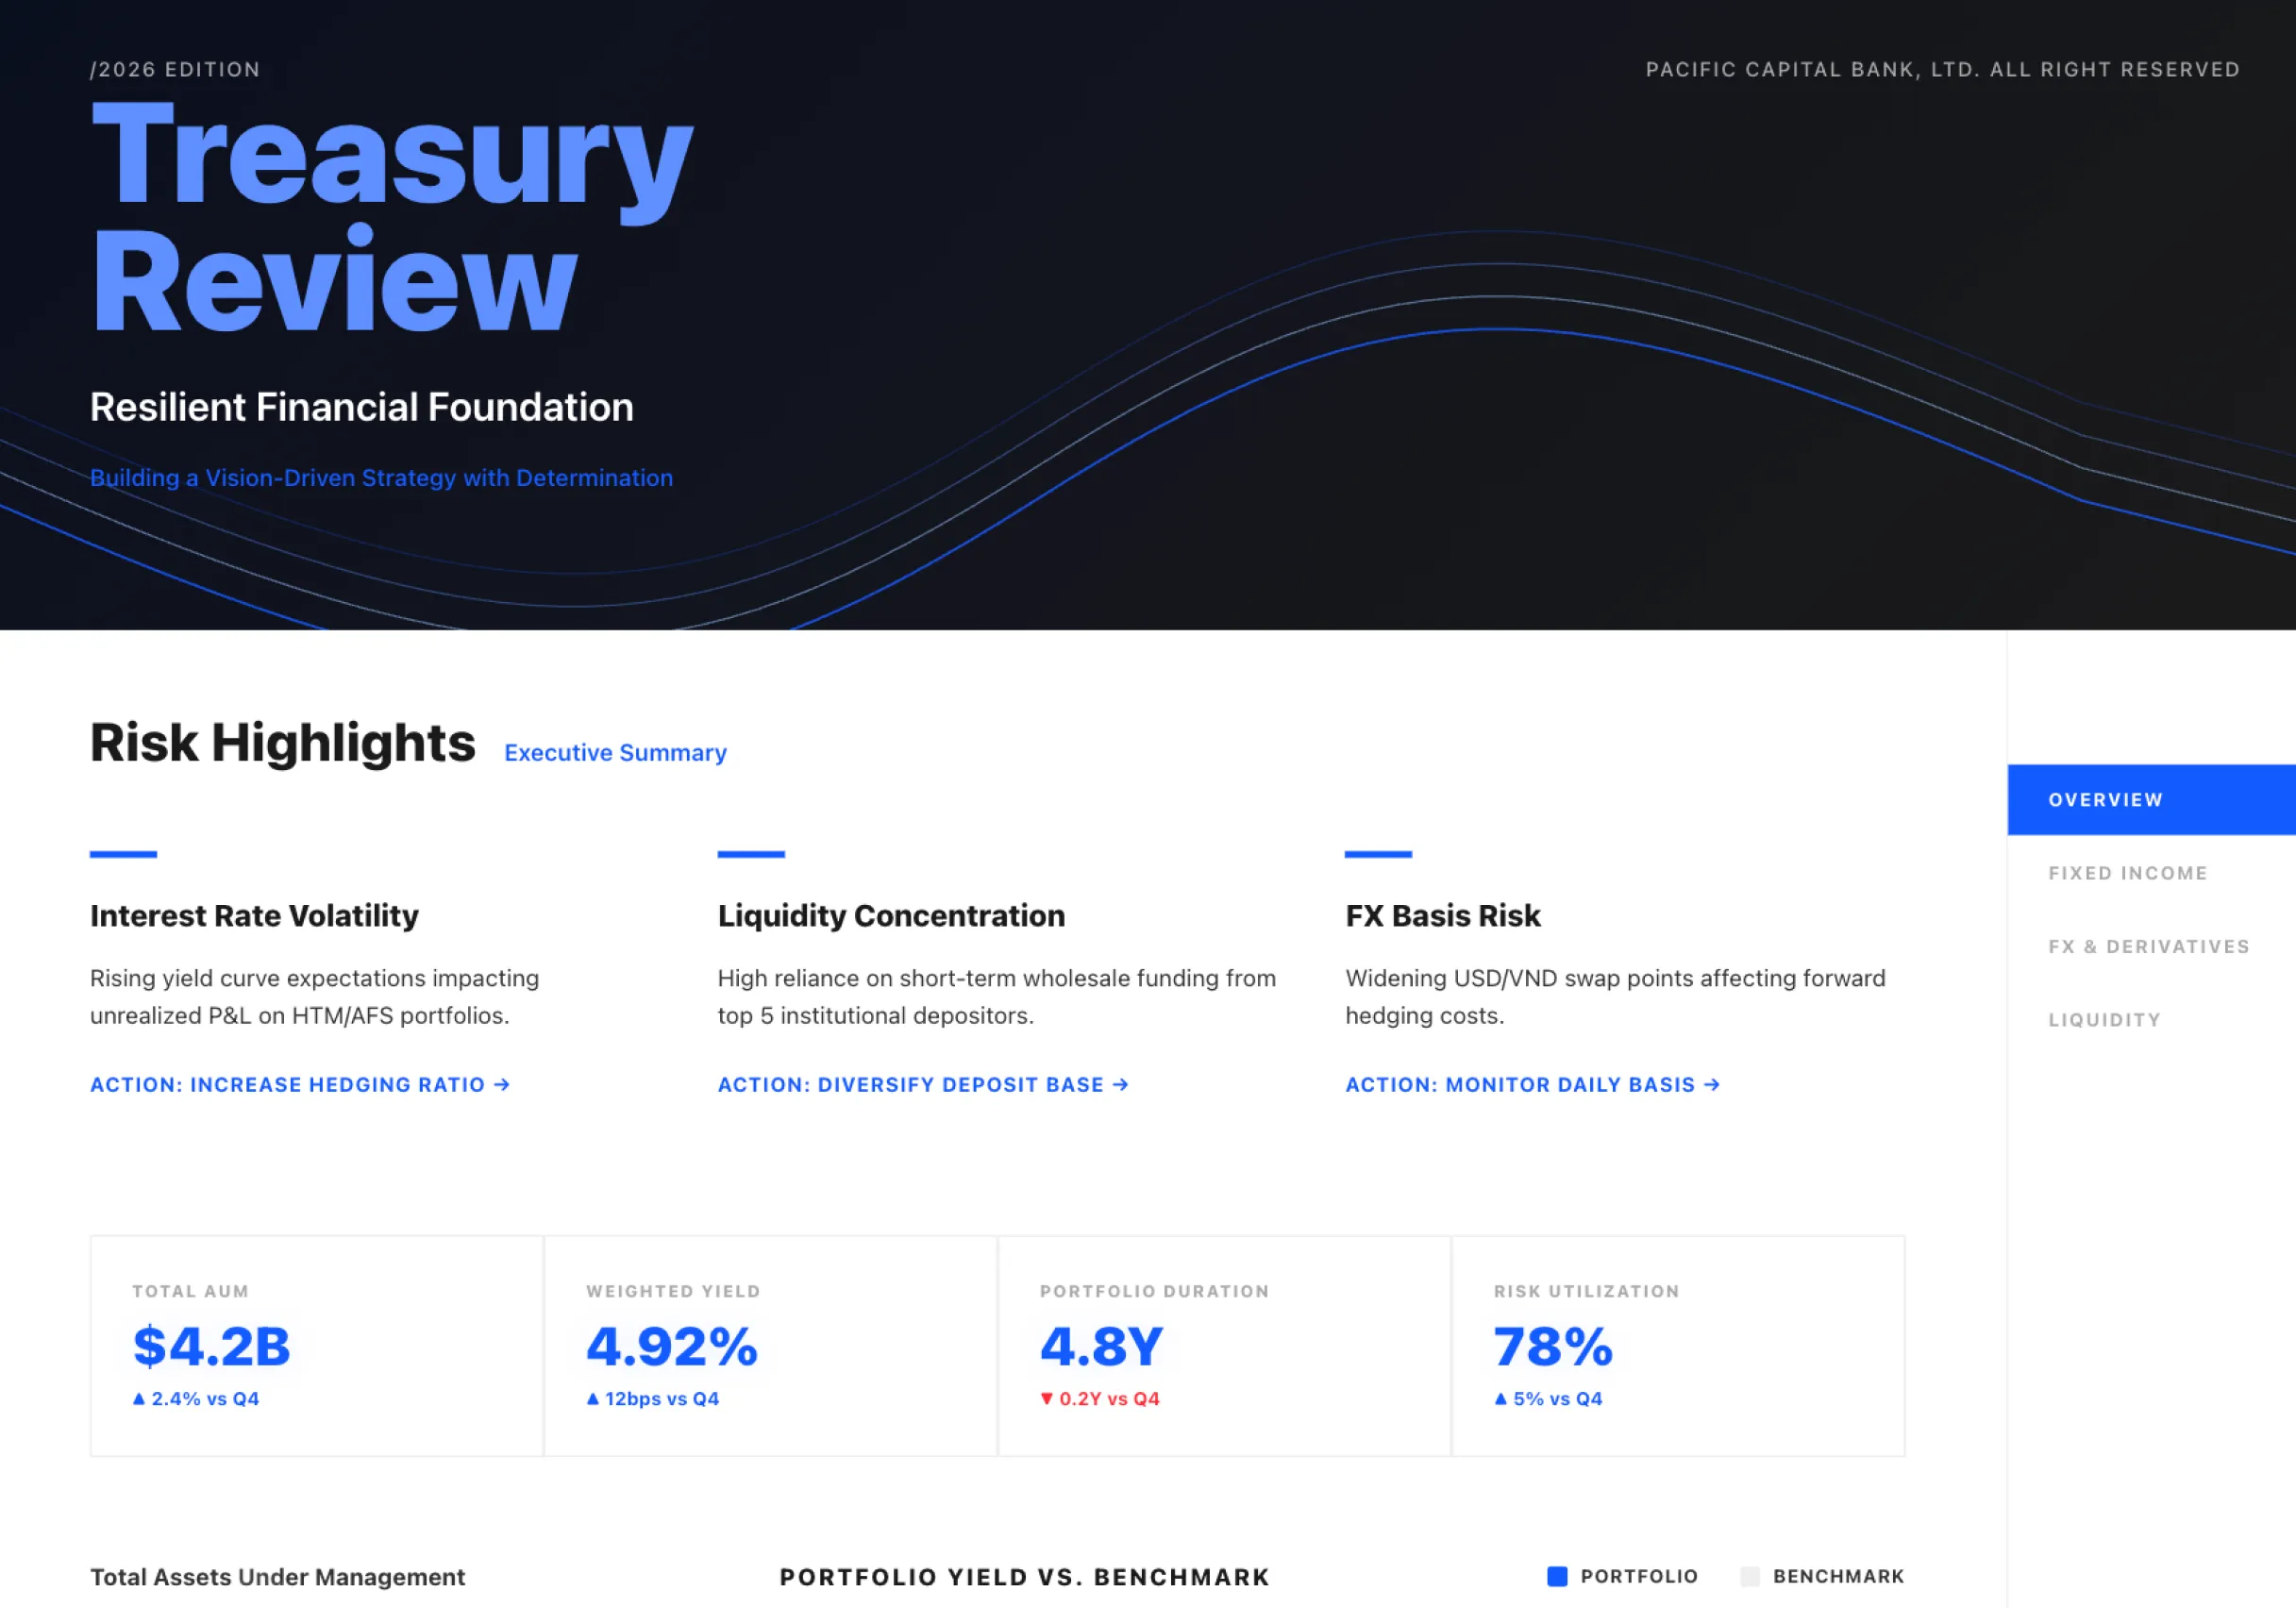
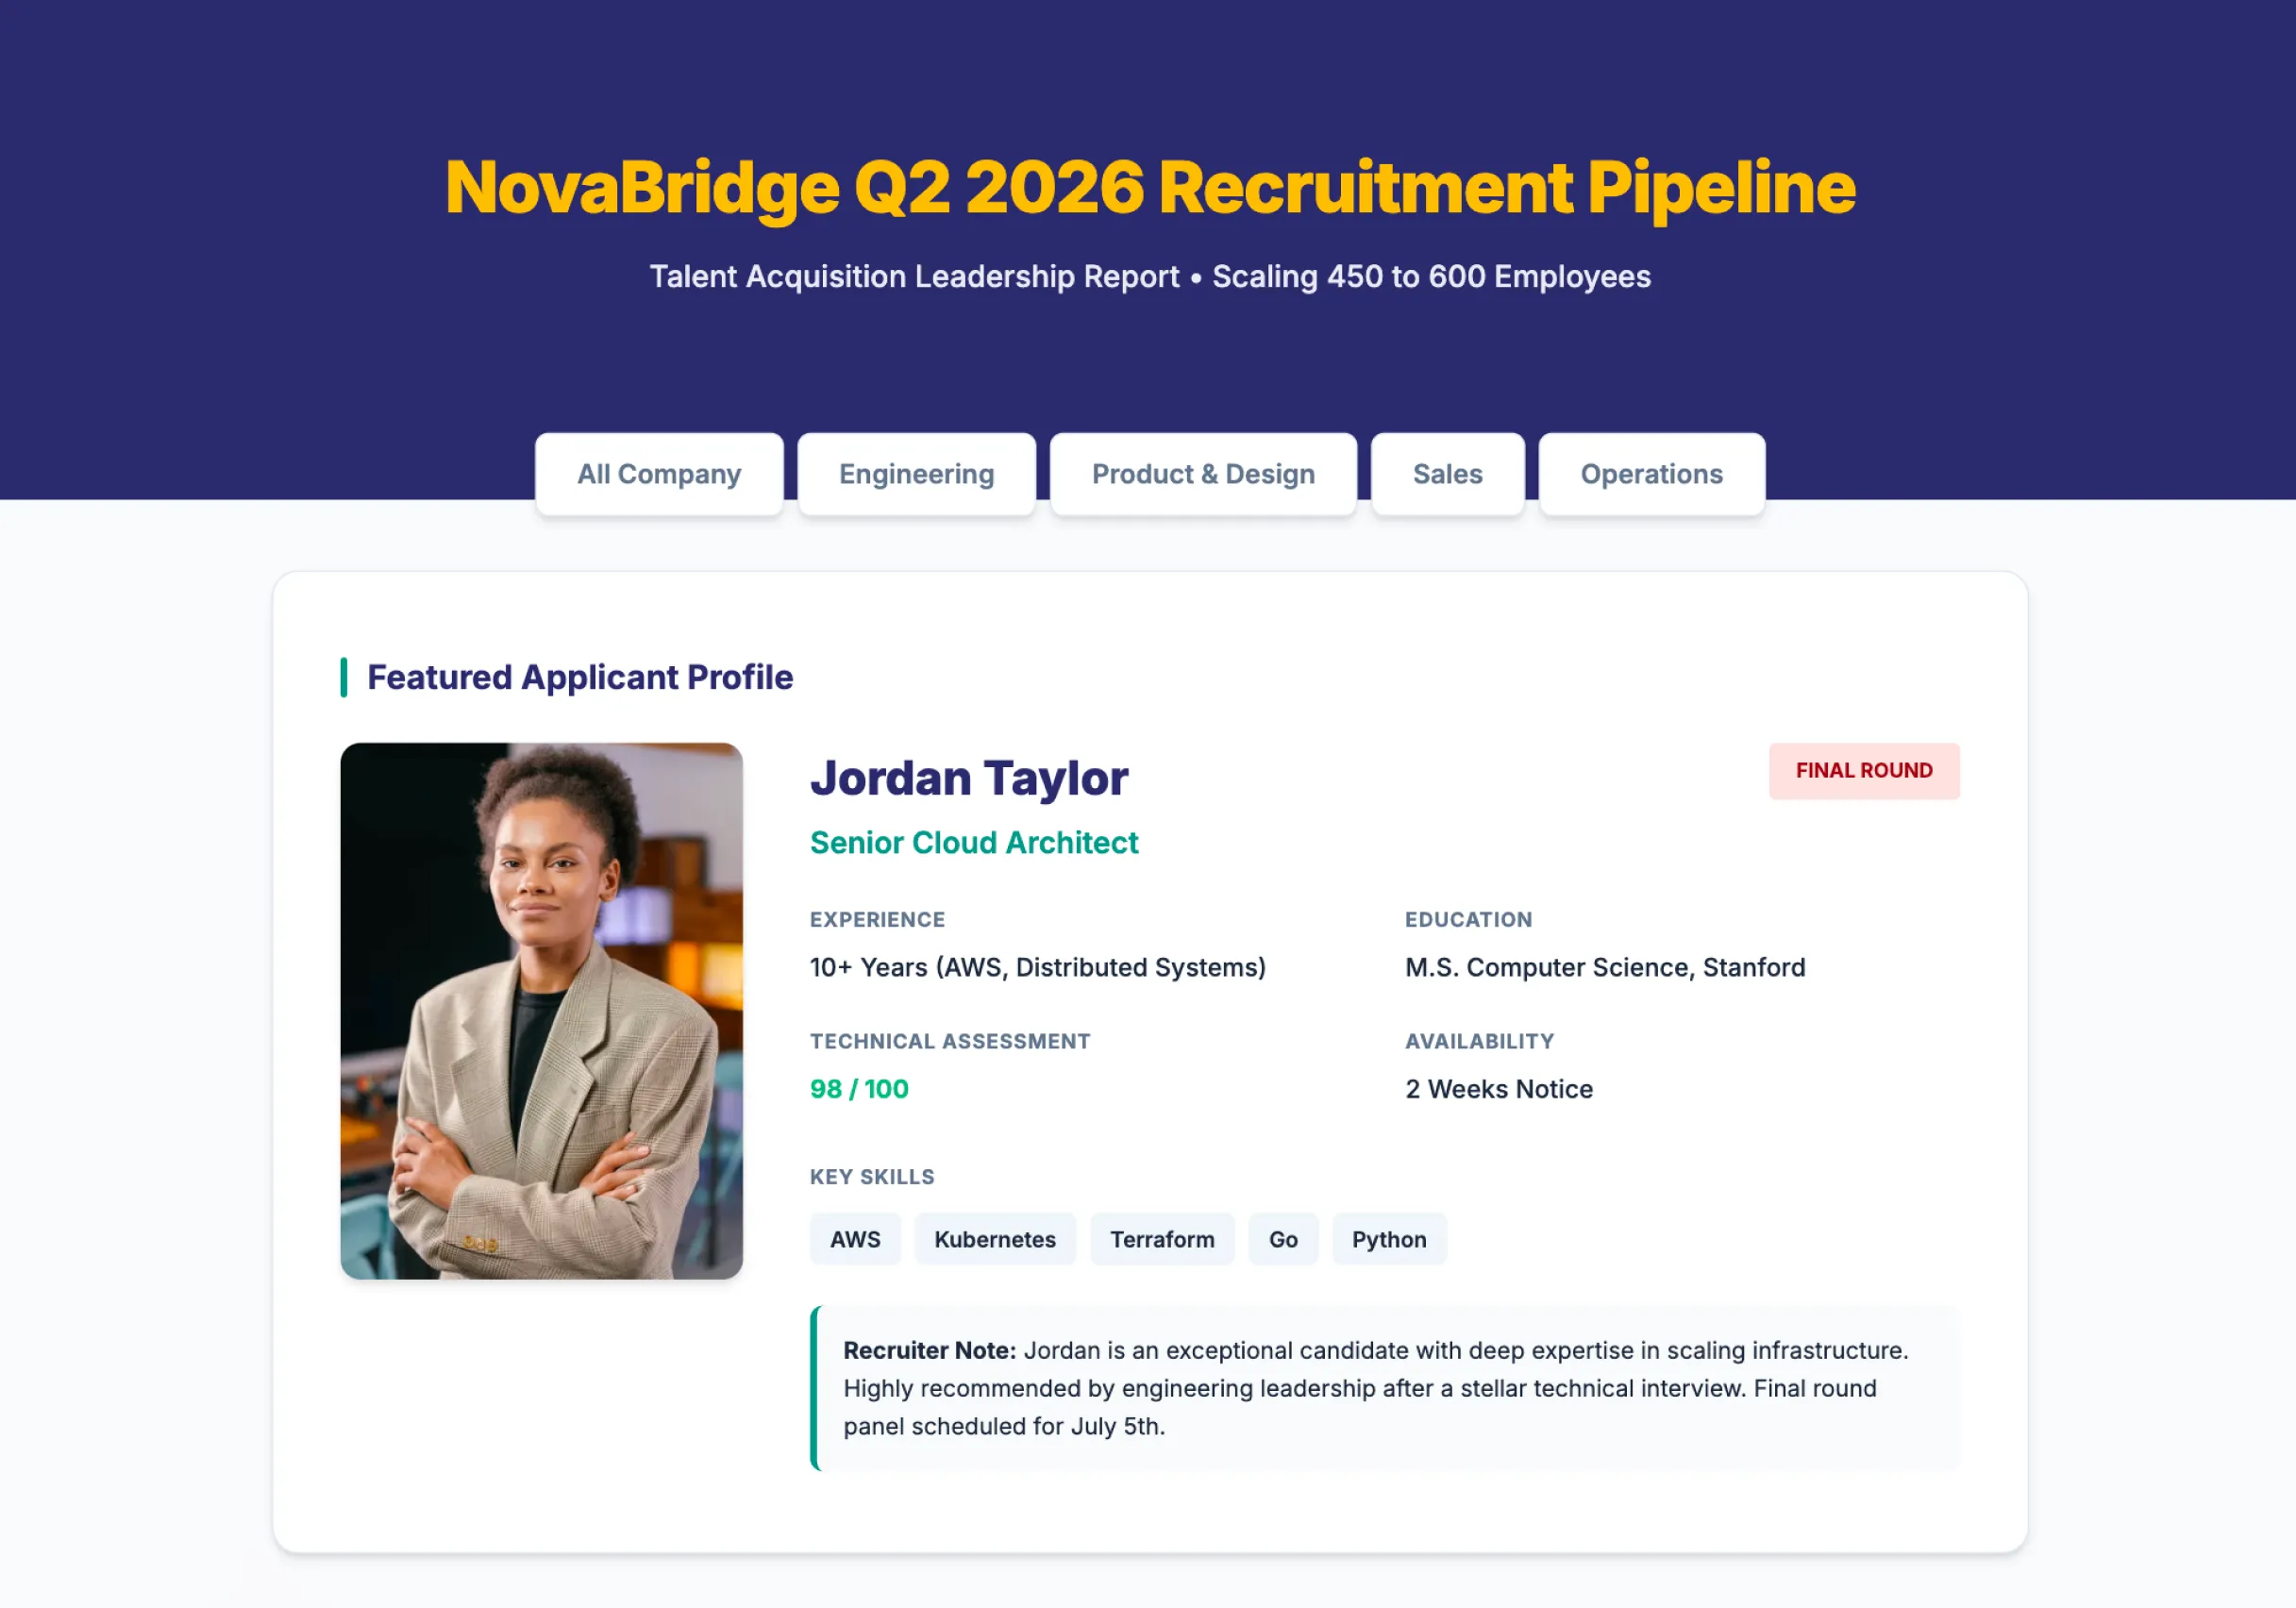
More to Explore
Frequently Asked Questions
Is this just another AI template/doc generator?
No — Bristol is built for reporting deliverables. Charts are interactive and every number can be traced back to its source, so the output stands up in front of a client or leadership team.
Is this like v0 / Stitch / Figma? Do I still need a developer?
No. Bristol is for business users. It's creation-first: it listens to your data + goal + brand, designs with you in conversation, and produces something that's ready to send — no handoff.
Is this a reporting dashboard suite like Databox?
Bristol doesn't win on "integration count" at launch. It wins on output quality: on-brand, interactive, sourced deliverables that feel like your work — not the tool's template.