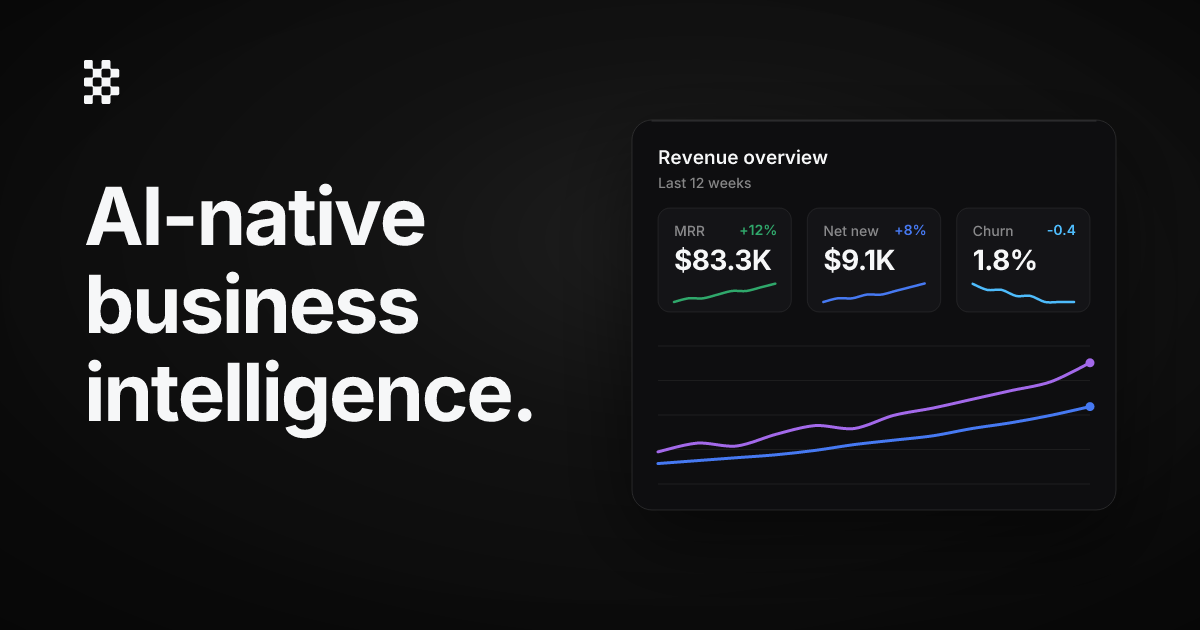


AI-Native Business Intelligence
AI\-Native Business Intelligence
Build charts, dashboards, and reports in seconds using all your data.
Trusted by 200+ teams to ship data answers fast


 “We evaluated Omni and other BI tools, but the speed to insight with Basedash is unmatched.”
 Greg DemogeCo-founder & CPO · FullEnrichRead case study →
 “Before Basedash, reports could take weeks of back and forth. Now, they can be ready in hours.”
 Claudio GodoyAI Agents Lead · TaxfyleRead case study →
Create dashboards with a prompt
Describe what you want to track and let Basedash generate a custom dashboard for you in minutes.
Revenue
$28.3K+68%(16,800)
400300200100
Jun 1, 2026Jun 30, 2026
New subscriptions
Live
508+189%(176)
500250100
Jun 1, 2026Jun 30, 2026
CAC
14 wks
Burnrate
$32.5K
Cohort retention
457\-31%(659)
| Cohort | Week 1 | Week 2 | Week 3 | Week 4 | Week 5 | Week 6 | | ------ | ------ | ------ | ------ | ------ | ------ | ------ | | 1 | 248 | 200 | 140 | 108 | 64 | 25 | | 2 | 112 | 104 | 58 | 6 | 2 | 0 | | 3 | 168 | 124 | 94 | 76 | 12 | 1 | | 4 | 98 | 76 | 51 | 51 | 12 | 14 | | 5 | 102 | 155 | 114 | 0 | 0 | 2 |
Runway in years
2.4
LTV in years
0.8
Generate a dashboard showing our core growth KPIs
Ask anything about your business
Get instant answers, uncover important trends, and make confident decisions faster.
MarketingWhich categories or segments contributed the most revenue or transactions?ProductIdentify the magic moment that predicts long-term engagement.EngineeringFind domains or metadata for a list of organizations from builder records.Data & AnalyticsPull IDs or names for items matching a keyword across connected sources.SalesWhich opportunities are stuck beyond the expected stage duration?SalesWhat accounts had the largest expansions this quarter?SalesWhich organizations that have not converted to paid are the most active?OperationsWhich customers are running into more bugs recently?Data & AnalyticsIdentify top entities (e.g., products, practices, segments) by net earnings or volume.SalesWhich accounts are likely to expand based on recent product activity?ProductShow onboarding conversion rate compared to last month.ProductAre there any features we added recently that increased engagement?Data & AnalyticsBuild a quick-start KPI dashboard with filters and best-practice layout.MarketingAre we seeing a drop in lead volume year over year? Which months and segments are down?ProductWhich product areas are slowing users down (timeouts, latency, error-prone steps)?ProductWhich cohorts have the highest week-8 retention?EngineeringMake table links open detailed views in our admin tool.Data & AnalyticsTrend key KPIs over time and flag abnormal spikes.MarketingList Google Ads campaigns and show CPC trends for each.MarketingWhat should be on a performance dashboard for our account managers?OperationsGive me a table of all new users with their signup source/medium.OperationsFilter paid organizations and show their current usage details.OperationsSurface users who recently hit errors or experienced slow response times.ProductShow retention by cohort and first-usage month.OperationsWhich customers have open issues tied to performance or reliability?MarketingWhich categories or segments contributed the most revenue or transactions?ProductIdentify the magic moment that predicts long-term engagement.EngineeringFind domains or metadata for a list of organizations from builder records.Data & AnalyticsPull IDs or names for items matching a keyword across connected sources.SalesWhich opportunities are stuck beyond the expected stage duration?SalesWhat accounts had the largest expansions this quarter?SalesWhich organizations that have not converted to paid are the most active?OperationsWhich customers are running into more bugs recently?Data & AnalyticsIdentify top entities (e.g., products, practices, segments) by net earnings or volume.SalesWhich accounts are likely to expand based on recent product activity?ProductShow onboarding conversion rate compared to last month.ProductAre there any features we added recently that increased engagement?Data & AnalyticsBuild a quick-start KPI dashboard with filters and best-practice layout.MarketingAre we seeing a drop in lead volume year over year? Which months and segments are down?ProductWhich product areas are slowing users down (timeouts, latency, error-prone steps)?ProductWhich cohorts have the highest week-8 retention?EngineeringMake table links open detailed views in our admin tool.Data & AnalyticsTrend key KPIs over time and flag abnormal spikes.MarketingList Google Ads campaigns and show CPC trends for each.MarketingWhat should be on a performance dashboard for our account managers?OperationsGive me a table of all new users with their signup source/medium.OperationsFilter paid organizations and show their current usage details.OperationsSurface users who recently hit errors or experienced slow response times.ProductShow retention by cohort and first-usage month.OperationsWhich customers have open issues tied to performance or reliability?
EngineeringHow many auth configs or connected accounts exist for provider X?SalesList all workspaces with an upcoming renewal in the next month.EngineeringShow recent error logs and users impacted in the last week.ProductWhich features correlate most with conversion to paid?EngineeringFetch IDs created in a given month for a specific provider or integration.SalesWhat should a sales-facing dashboard include for quick qualification and follow-up?MarketingHow many deals or opportunities are in our current campaign from a specific region?SalesHow many leads are currently close to closing?Data & AnalyticsHow many records/jobs/tasks were created or submitted in a given timeframe?Data & AnalyticsBreak down counts by type (categories, forms, service items) and show percentages.MarketingShow campaigns with delivery errors that still spent in the last 24 hours.EngineeringWhich SDK versions or app versions are most error-prone?OperationsShow customers with at least two visits or repeat usage in the last month.ProductDid anything else spike when a specific feature usage increased?SalesWhich accounts are a churn risk?EngineeringWhat are the most common errors this month, and what endpoints are causing them?OperationsWhich tickets are trending by category and time to resolution?SalesWho are the most engaged accounts in the last 14 days?MarketingWhat is our CAC?EngineeringWhich services or endpoints have the highest error rates this week?MarketingWhat is our blended cost per lead and cost per acquisition by channel?MarketingWhich campaigns or channels drove the most leads and conversions this month?ProductWhat is our WAU/MAU and how is it trending?MarketingWhich geographies are performing best this quarter by pipeline and closed-won?Data & AnalyticsShow me revenue and subscription growth.EngineeringHow many auth configs or connected accounts exist for provider X?SalesList all workspaces with an upcoming renewal in the next month.EngineeringShow recent error logs and users impacted in the last week.ProductWhich features correlate most with conversion to paid?EngineeringFetch IDs created in a given month for a specific provider or integration.SalesWhat should a sales-facing dashboard include for quick qualification and follow-up?MarketingHow many deals or opportunities are in our current campaign from a specific region?SalesHow many leads are currently close to closing?Data & AnalyticsHow many records/jobs/tasks were created or submitted in a given timeframe?Data & AnalyticsBreak down counts by type (categories, forms, service items) and show percentages.MarketingShow campaigns with delivery errors that still spent in the last 24 hours.EngineeringWhich SDK versions or app versions are most error-prone?OperationsShow customers with at least two visits or repeat usage in the last month.ProductDid anything else spike when a specific feature usage increased?SalesWhich accounts are a churn risk?EngineeringWhat are the most common errors this month, and what endpoints are causing them?OperationsWhich tickets are trending by category and time to resolution?SalesWho are the most engaged accounts in the last 14 days?MarketingWhat is our CAC?EngineeringWhich services or endpoints have the highest error rates this week?MarketingWhat is our blended cost per lead and cost per acquisition by channel?MarketingWhich campaigns or channels drove the most leads and conversions this month?ProductWhat is our WAU/MAU and how is it trending?MarketingWhich geographies are performing best this quarter by pipeline and closed-won?Data & AnalyticsShow me revenue and subscription growth.
AI answers from your trusted metrics
Define your metrics once, and Basedash uses them to build reports you can trust.
MRR
Verified
Monthly recurring revenue from active subscriptions.
1select
2 date\_trunc('month', created\_at)
3 as month,
4 sum(amount) as mrr
5from subscriptions
6where status \= 'active'
7group by month
How is our MRR trending?
MRR by month
Verified
$83.3K
JanFebMarAprMayJun
All your data in one place
Connect your own warehouse, or use Basedash Warehouse to visualize all your data in one place.





















































































Your data stays yours
The controls your security team expects, from day one.
SOC 2 Type II
Audited annually with continuous monitoring.
Encryption everywhere
Data encrypted in transit and at rest.
Never trains on your data
Customer data is never used to train models.
Role-based access
RBAC and row-level security on every source and metric.
SSO and SCIM
Single sign-on (SAML, OIDC) with SCIM provisioning.
Cloud or self-hosted
Deploy inside your own network boundary.
Explore securityView compliance
FAQ
What is an AI-native business intelligence platform?
An AI-native business intelligence (BI) platform uses natural language processing to let teams query databases, generate dashboards, and explore analytics without writing SQL. Basedash lets teams ask questions in plain English and turn answers into dashboards, automations, and shared workflows quickly. It covers the full data stack in one product — storage, data syncing, a semantic layer for trusted metrics, and the BI and reporting on top — so analytics stay consistent from raw data to final dashboard. The result is faster time-to-insight with less manual query work and fewer handoffs between teams.
How is Basedash different from traditional BI tools like Metabase or Tableau?
AI-native BI is significantly faster and less brittle than traditional BI for day-to-day analytics work. Traditional tools often depend on SQL-heavy workflows, manual dashboard setup, and multiple rounds of query iteration before teams get a usable answer. Basedash reduces that friction by moving from plain-English prompt to governed chart quickly, so teams ship dashboards in minutes instead of waiting on longer setup cycles.
How is Basedash different from AI tools like ChatGPT or Claude Code?
General AI tools are useful for brainstorming, but Basedash is purpose-built for production analytics. Basedash connects directly to your real data stack, understands your database schema, tables, and metric definitions, and returns answers grounded in governed sources. It is designed for teams with shared dashboards, reusable metrics, role-based access controls, and deployment options that match security and compliance requirements. The result is faster time-to-insight with more consistent and trustworthy answers.
What data sources does Basedash support?
Basedash supports 750+ integrations across databases, warehouses, and SaaS tools, including PostgreSQL, MySQL, Snowflake, BigQuery, Salesforce, HubSpot, Stripe, and Google Analytics. Teams can connect their existing stack directly and keep analysis grounded in governed business data. You can explore the full integration catalog and source categories on the data sources page.
How does Basedash prevent hallucinations and ensure AI analysis is accurate?
Basedash is designed to prioritize accuracy in production analytics. Instead of generating freeform answers, it translates natural language into structured queries that are validated and executed directly against your connected databases or warehouses. Responses are grounded in your actual schema, tables, and governed metric definitions. Generated queries can be reviewed, traced to underlying data, and re-run for verification. By constraining AI within your real data environment and enforcing shared definitions and access controls, Basedash combines AI speed with the reliability of traditional BI systems. On BI Bench, our public benchmark of AI data analyst agents, Basedash is the most accurate and the fastest tool tested.
Is Basedash secure for production and enterprise use?
Basedash is designed for production and enterprise environments with concrete security controls, including SOC 2 Type II compliance, encryption in transit and at rest, and strict data access boundaries. Customer data is never used to train models. Teams can enforce role-based access controls, single sign-on (SSO with SAML and OIDC), SCIM user provisioning, and native audit logs, define trusted metrics, and deploy in self-hosted or VPC-based environments to meet internal network and compliance requirements. See our compliance page for SOC 2, HIPAA, ISO 27001, and GDPR details. This allows organizations to adopt AI-native analytics without compromising their existing security posture.
Get started in under 30 minutes
We can help you migrate your data and dashboards from any other tool.