haydenjames/VPS-Disk-Latency-Bench
Latency-focused disk benchmarks for Linux VPS environments. - haydenjames/VPS-Disk-Latency-Bench
10 stars · 1 forks · 0 watchers · Shell Topics: linux, benchmark, vps, fio, sysadmin-scripts, latency-test
README
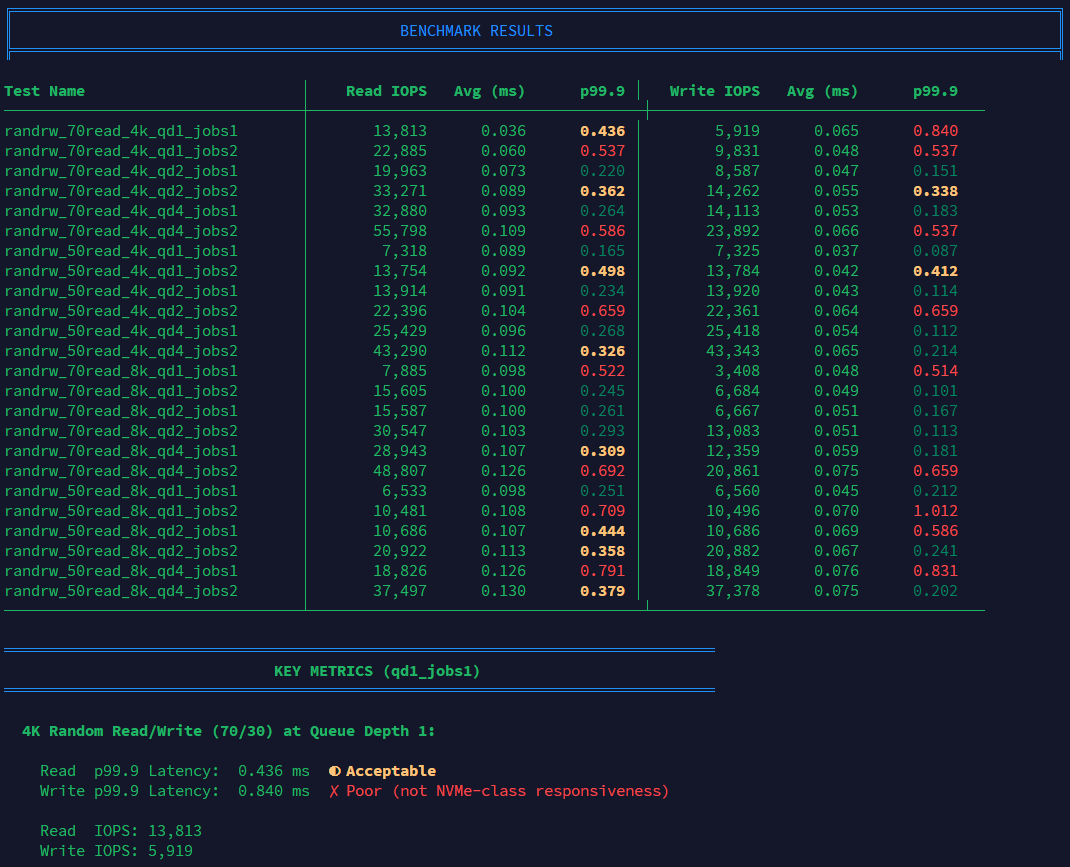
VPS Disk Latency Bench (fio) Latency-focused disk benchmarks for VPS environments. This script runs small-block mixed random I/O at low queue depths and light concurrency, then prints a formatted results table with color-coded latency assessments.
Why latency, not IOPS? Most VPS workloads (web servers, databases, applications) operate at queue depth 1-2 with single-threaded I/O. High IOPS numbers from synthetic benchmarks at qd32+ don't reflect real-world performance. Why VPS focused? This script works on any Linux system: dedicated servers, cloud instances, homelab boxes, local workstations. The VPS framing is about audience, not technical scope. VPS buyers are the ones most often misled by inflated IOPS numbers from providers running synthetic qd32 benchmarks on marketing pages. But anyone evaluating storage latency under realistic workloads will find the results useful. It's just fio with sensible parameters. This script tests what actually matters: p99.9 latency at low queue depth. Read more: VPS IOPS vs. Latency: Why NVMe Benchmarks Lie Features
Formatted table output with aligned columns Color-coded p99.9 latency (green/yellow/red thresholds) Key metrics summary highlighting the most important qd1 results Pass/fail assessment against 0.3ms NVMe threshold Progress indicator during test execution JSON + TXT output for both human reading and scripting
Requirements Required:
fio
Standard tools (present on most Linux systems):
dd, awk, sed, date, hostname
Optional:
bc (used for floating-point comparisons; falls back to awk) tput (for colorized output, if supported) jq (only needed if you want to manually inspect the raw JSON output)
Quick Start
Download
curl -O https://raw.githubusercontent.com/haydenjames/VPS-Disk-Latency-Bench/main/bench-io.sh chmod +x bench-io.sh ./bench-io.sh # Run with defaults (2GB file, 30s per test)Quick test (smaller file, shorter runtime)
FILE_SIZE_GB=1 RUNTIME_SEC=10 ./bench-io.sh Sample Output ╔═══════════════════════════════════════════════════════════════════════════╗ ║ VPS Disk Latency Benchmark - Latency-Focused Testing ║ ╚═══════════════════════════════════════════════════════════════════════════╝Test Name │ Read IOPS Avg (ms) p99.9 │ Write IOPS Avg (ms) p99.9 ─────────────────────────────────┼─────────────────────────────────────┼───────────────────────────────────── randrw_70read_4k_qd1_jobs1 │ 9,013 0.089 0.157 │ 3,882 0.036 0.089 randrw_70read_4k_qd1_jobs2 │ 17,238 0.091 0.214 │ 7,397 0.041 0.098 ...
═══════════════════════════════════════════════════════════════════════════════ KEY METRICS (qd1_jobs1) ═══════════════════════════════════════════════════════════════════════════════
4K Random Read/Write (70/30) at Queue Depth 1:
Read p99.9 Latency: 0.157 ms ✓ Excellent (NVMe-class) Write p99.9 Latency: 0.089 ms ✓ Excellent (NVMe-class)
Latency Thresholds: < 0.3ms = Excellent (true NVMe-class performance) < 0.5ms = Acceptable >= 0.5ms = Poor (likely throttled, shared, or not true NVMe)
Configuration Override defaults via environment variables:
Variable Default Description
FILE_DIR /var/tmp Directory for test file
FILE_SIZE_GB 2 Test file size in GiB
RUNTIME_SEC 30 Runtime per test in seconds
WARMUP_SEC 5 Warmup time before each test
IODEPTHS 1 2 4 Queue depths to test
BS_LIST 4k 8k Block sizes to test
MIX_LIST 70 50 Read percentages (70 = 70% read, 30% write)
JOBS_LIST 1 2 Number of parallel jobs
ENGINE libaio fio I/O engine
OUTPUT_DIR ./bench_out Output directory
Examples
Minimal test (fastest)
FILE_SIZE_GB=1 RUNTIME_SEC=5 IODEPTHS="1" BS_LIST="4k" MIX_LIST="70" JOBS_LIST="1" ./bench-io.shFull test with larger file
FILE_SIZE_GB=4 RUNTIME_SEC=60 ./bench-io.shCustom output directory
OUTPUT_DIR=/tmp/benchmarks ./bench-io.sh Output Files The script creates two files in ./bench_out/ (or $OUTPUT_DIR):File Description
fio-<hostname>-<timestamp>.txt Formatted summary with tables, key metrics, and raw data
fio-<hostname>-<timestamp>.json Raw fio JSON output for programmatic analysis
What to Look For Focus on p99.9 latency in the 4k_qd1_jobs1 tests:
p99.9 Latency Assessment
< 0.3ms ✅ Excellent - True NVMe-class performance
< 0.5ms ⚠️ Acceptable - Reasonable for most workloads
≥ 0.5ms ❌ Poor - Likely throttled, noisy neighbors, or not true NVMe
Warning signs:
IOPS that flatline at round numbers (e.g., 20,000) suggest rate limiting High IOPS with high latency indicates oversubscribed storage Erratic latency across tests suggests noisy neighbors
Changelog v2.0.0 (2026-02-03)
New: Formatted table output with Unicode box drawing New: Color-coded p99.9 latency (green/yellow/red) New: Key metrics summary section New: Pass/fail assessment against thresholds New: Progress indicator during tests New: Improved TXT output with multiple sections Fixed: Compatibility with various fio versions Fixed: Robust JSON parsing
v1.0.0
Initial release
License MIT Author Hayden James - Linux systems analyst.