
Your Mac, at a glance.

Your Mac, at a glance.
A lightweight system monitor that lives in your macOS menu bar.
Download for macOSv1.4.0 · 4.4 MB · macOS 15+Free and open source
Nothing leaves your Mac
English · Türkçe · Русский · Español · Français · Português
[](https://mectrics.app/?ref=producthunt#product)
Mectrics in your menu barLive metrics

Set it once
Make the menu bar yours.
Pick the numbers you care about. Everything else stays out of the way. Set a threshold and Mectrics speaks up when something is off.
CPUMemoryBatteryNetworkDiskGPUTemperatureFans
Temperature sits inside CPU, Memory and GPU. Hardware this Mac does not have hides itself.


Click for more
The detail behind the number.
Every item opens a popover with what is actually going on.
CPU: a bar per core

Disk: capacity and live throughput

Quiet by default
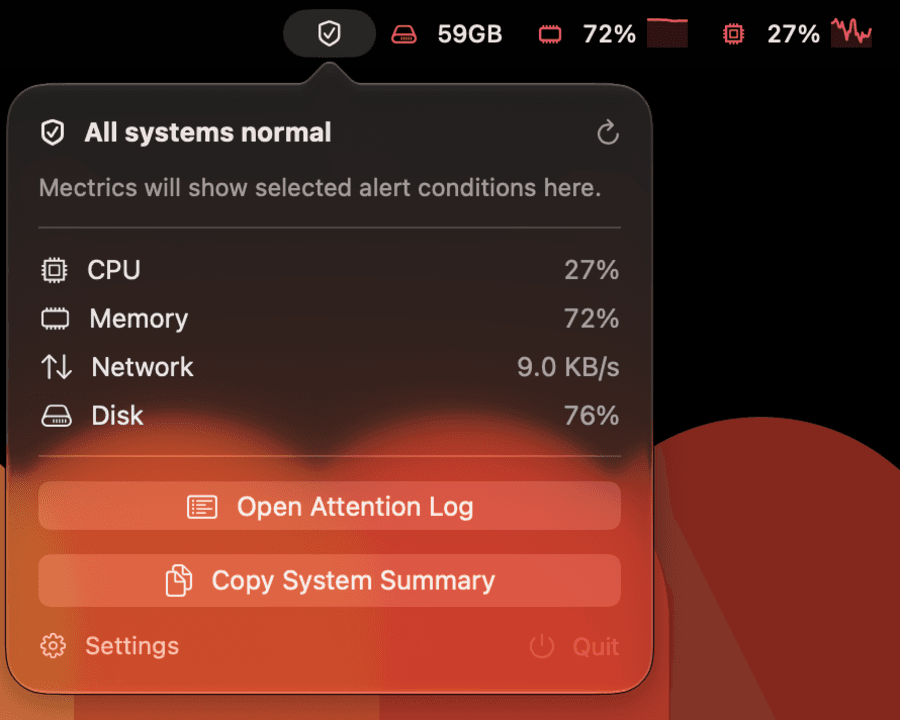
One item, until it matters.
Compact Health folds the whole machine into a single menu bar item and stays out of the way. It speaks up only when a condition holds — a brief spike is not news.
Rules watch either a number you pick or a state macOS reports itself, like your Mac slowing its CPU and GPU down to cool off. A hot sensor and a machine that has actually been slowed are not the same thing, and only the second one costs you time.
For headless Macs
An exit code, not a parser.
Mectrics ships a read-only `mectrics` command inside the signed app bundle. It reads the rules you already configured and drops straight into cron or an existing monitoring check.
`check` exits 0 when everything is within its limit and non-zero when it is not. Add `--json` when you want the detail, `alerts watch` to stream events as they happen. It changes no settings and makes no network requests. Read the docs.
$ mectrics check
HEALTHY · 3 rules checked
$ echo $?
0$ mectrics alerts watch
ALERT system.thermalPressure
RECOVERED system.thermalPressure