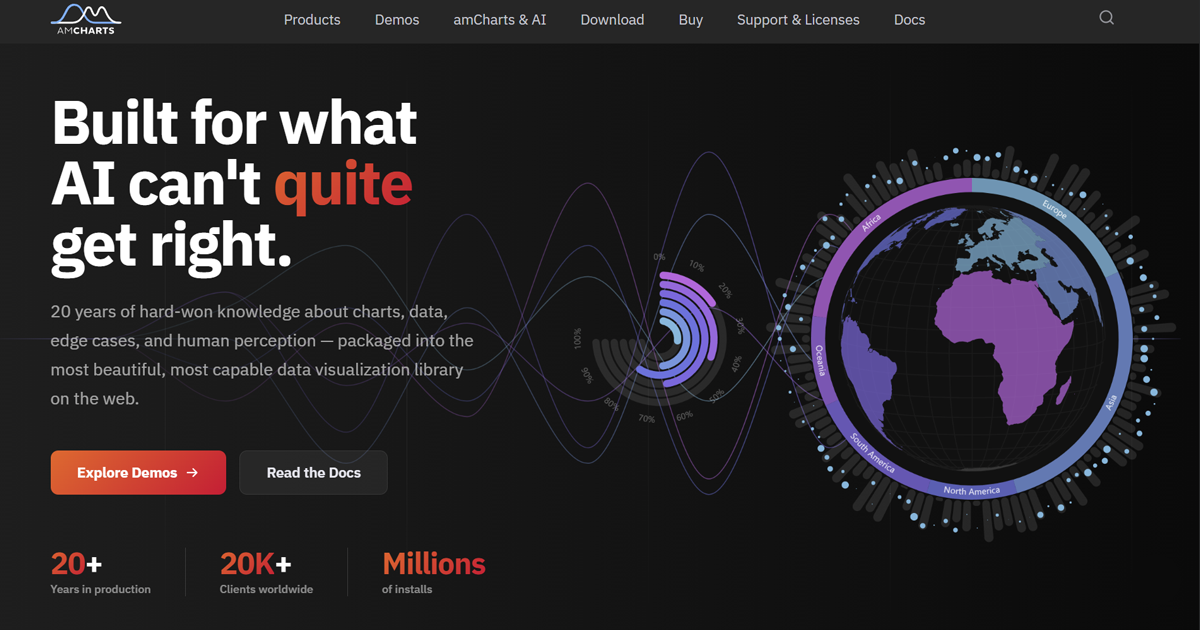
Built for what
AI can't quite get right.:
:
:
:
:
:
Built for what
AI can't quite get right.20 years of hard-won knowledge about charts, data, edge cases, and human perception — packaged into the most beautiful, most capable data visualization library on the web.
20+
Years in production
20K+
Clients worldwide
Millions
of installs
Trusted by 20,000+ companies worldwide
Microsoft Amazon Apple NASA Samsung IBM Cisco PayPal eBay Deutsche Bank Citi J.P. Morgan Bank of America HSBC Credit Suisse Pfizer P&G SAP Siemens Audi AT&T Emirates Morningstar Symantec Mailchimp Red Bull
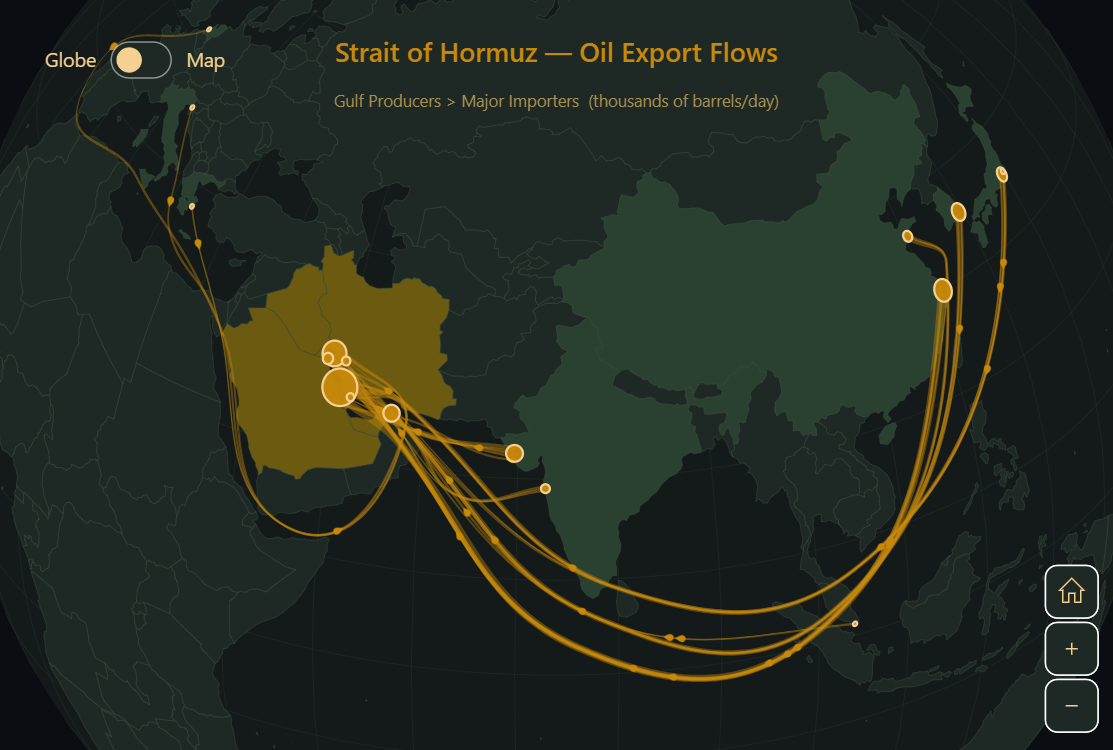 Sankey Map With Waypoints Animated crude oil flows from Gulf terminals through the Strait of Hormuz to refineries across Asia and Europe.
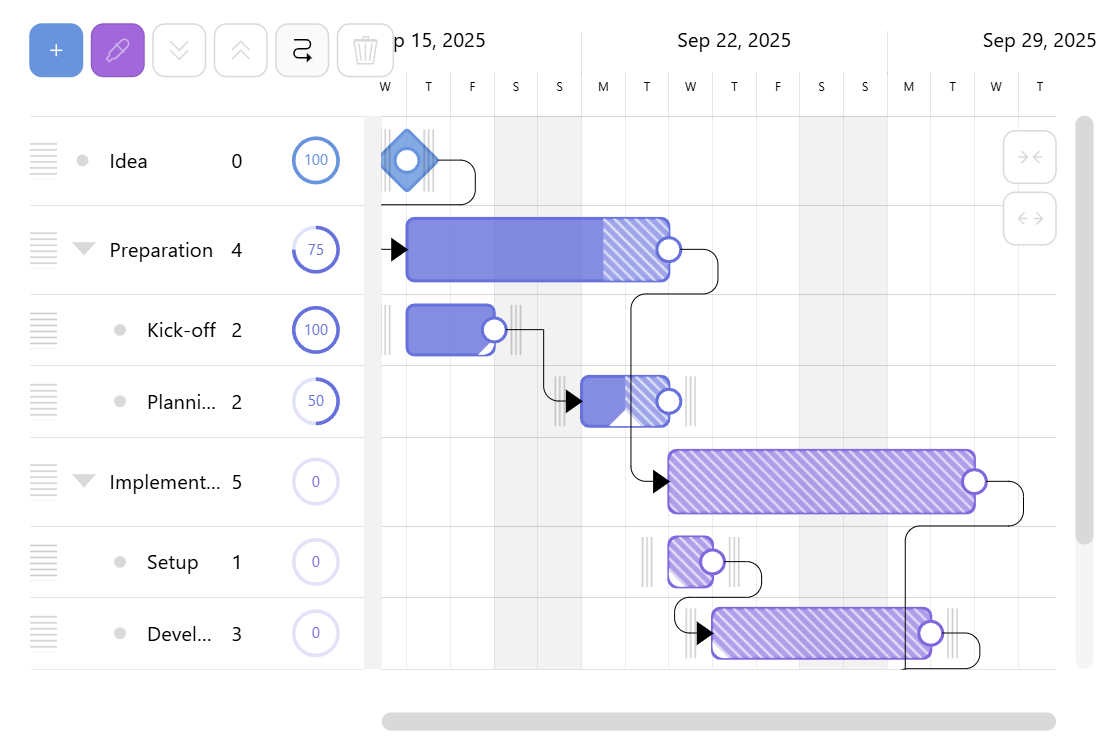 Editable Multilevel Gantt Chart Drag-and-drop project planner with nested tasks, dependencies, and live progress updates.
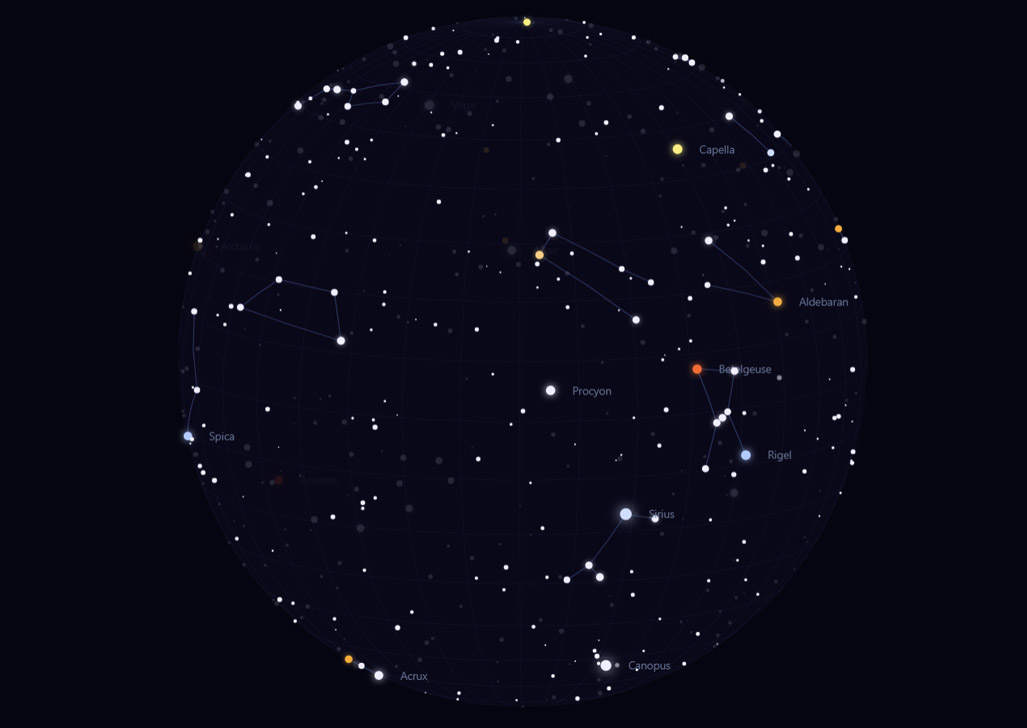 Celestial Sphere Interactive 3D star globe with named constellations, auto-rotation, and twinkling stars.
"Can't AI just generate my charts?"
Sure. And the first result will look great.
Then you'll need an interactive legend. Then zoom and scroll. Then responsive layouts on mobile. Then accessible labels. Then data grouped into weeks and months automatically. Then smooth transitions between datasets.
Each requirement means another prompt. Each prompt introduces new bugs. You end up debugging AI output instead of shipping your product.
The amCharts answer: one prompt, done.
Tell AI to use amCharts and all of the above comes built in. No extra prompts, no fragile workarounds — a real charting engine does the heavy lifting.
Everything built in
60+ chart types, each with legends, zoom, tooltips, scrollbars, responsive layouts, and accessibility. No plugins, no assembly required.
AI that writes correct code
We ship MCP servers and skill files so AI generates idiomatic amCharts code — not hallucinated syntax from three libraries mixed together.
Battle-tested for 20 years
AI speed on top of a platform trusted by thousands of companies. Fast to build, reliable in production.
Why amCharts
Not a charting library.
A data-viz platform.amCharts: Charts 60+ chart types — bars, pies, Sankey, treemap, spiral, and types nobody else has. Explore Charts amCharts: Maps Interactive geo maps with hundreds of bundled GeoJSON datasets, heat rules, and point clustering. Explore Maps amCharts: Stock Chart Professional financial charting with 34 built-in indicators, 22 drawing tools, and multi-panel layouts. Explore Stock Chart Jan Feb Mar Apr amCharts: Gantt Drag-and-drop project timelines with dependency links, resource allocation, and full event API. Explore Gantt
Composable layouts
Multiple charts in one container. Stack them, grid them, overlay them — a pie chart on top of a map, a gauge beside a line chart. Built-in scrollbars, buttons, resize handles, and color pickers let you build complete apps without leaving amCharts.
60+ chart types
The widest range in any single library. Line, area, Sankey, treemap, radar, maps, stock, Gantt — plus types nobody else has: serpentine timelines, spiral charts, Voronoi treemaps, packed circles.
Everything animates
Any element, any property — including the data itself. Zoom and scroll feel silky smooth because amCharts animates data values, not DOM elements. The difference is visceral.
Canvas-powered speed
Built on HTML5 Canvas, not SVG. Faster rendering, smoother interactions, smaller memory footprint. The performance gap grows with every data point you add.
AI-friendly by design
amCharts was always powerful but had a learning curve. AI eliminates it. We ship MCP servers, skill files, and structured docs so AI writes correct amCharts code — not hallucinated syntax.
Accessibility built in
Screen reader support, keyboard navigation, focusable elements, ARIA attributes — first-class, not retrofitted. Pass enterprise accessibility audits out of the box.
Licensing
Free. Even for commercial use.
Use amCharts at no cost — on any project, including commercial — with a small backlink. When you're ready to remove it, choose the plan that fits.
Free
$0
forever
Full functionality with a small amCharts backlink. Fully featured. No time or user limits.
- All chart types
- Commercial projects
- Unlimited users & pages
- No backlink
- Free version upgrades
- Source code access
- No backlink
- Lifetime license
- Source code access
Annual
from $80/yr
per developer seat
Charting as a subscription. Stay current with free upgrades, priority support (SaaS or OEM licenses), and predictable budgeting.
Perpetual
from $180
one-time, per developer seat
Buy once, use forever. No renewals, no expiration. Yours to keep — including all future updates to the version you purchase.
SaaS and OEM licenses also available. View full pricing →
20
Since 2006
Battle-tested
across 20 years of production.amCharts has shipped in products you've used — trading platforms, hospital dashboards, satellite telemetry, live election maps. Every edge case, every performance bottleneck, every API quirk is ironed out.
#### Not just charts — a complete platform
Layout engine, built-in UI controls, animation framework, data binding. Build entire data-driven applications, not just visualizations.
#### Every element is fully dynamic
Access and change any element at runtime — appearance, position, data, visibility. Your charts respond to your application, not the other way around.
#### Support from people who wrote the code
When you hit a strange edge case the night before a product launch, our team has likely seen it before. Real humans, real answers.
60+ chart types and counting
If it can be visualized,
amCharts can build it.From common charts to types nobody else offers — serpentine timelines, spiral charts, Voronoi treemaps, directed chord diagrams. One library handles them all.
Line Area Bar Column Pie Donut Scatter Bubble Candlestick OHLC Stock Map Sankey Chord Treemap Sunburst Force Radar Gauge Gantt Waterfall Funnel Heat Map Spiral Voronoi Violin Word Cloud Venn
Financial Charts
The most complete
stock chart on the web.Not a chart widget — a ready-to-go financial charting application. Technical indicators, interactive drawing tools, automatic data grouping, comparison series, and a full toolbar. No competitor comes close.
Used by banks, trading platforms, and fintech companies worldwide. Drop it in and ship.
Explore Stock Chart → Live demo
50+ Technical Indicators
MACD, RSI, Bollinger Bands, Moving Averages, Stochastic, and dozens more — all built in and configurable.
Interactive Drawing Tools
Trend lines, Fibonacci retracements, channels, labels, and custom annotations — drawn directly on the chart.
Automatic Data Grouping
Switch from minutes to months seamlessly. Data groups automatically based on zoom level — no manual aggregation needed.
Ready-to-Go Financial Tool
Toolbar, date picker, period selector, comparison tools, volume panel — a complete trading interface out of the box.
Interactive Maps
The most beautiful
maps on the web.Customers tell us the same thing: nothing else comes close. Smooth vector rendering, rich interactivity, and pixel-perfect detail that makes amCharts maps look like they belong in a design portfolio — not a developer tool.
Build dashboards, build apps, build games. Combine maps with charts to create data visualizations that are genuinely impossible anywhere else.
See what's possible
DataViz Dojo
A playground of interactive data-viz projects — map generators, chart races, geography games, animated recreations of classic visualizations. Built mostly with AI to show what's possible when amCharts meets modern tooling.
Explore all 60+ chart types with live examples and ready-to-copy code.
Map Generators
Create custom SVG maps, pixel art maps, and tessellation-based visualizations. SVG maps → · Pixel maps →
Chart Race Generator
Create animated bar chart races from your data. Export as video or embed live. Try it →
60+ Chart Types Catalog
Every chart type with live examples, descriptions, and code you can copy. Browse all →
amCharts Substack
Data-viz insights, product updates, and tutorials. Subscribe →
amCharts & AI
AI handles the complexity.
You keep the control.amCharts has always been powerful. Now AI eliminates the learning curve. Describe what you want — AI writes correct amCharts code.
MCP Server
amCharts MCP
Connect once — use our hosted server with nothing to install, or run it locally. Your AI assistant gets on-demand access to hundreds of doc pages with code examples, as well as 1,000+ API references. Works with Claude Code, Cursor, Windsurf, VS Code.
AI Skill
AI Skill Files
Drop the skill file into your project. Any AI tool — Claude, ChatGPT, Gemini, Copilot — gets a structured reference for every chart type. Works everywhere, no setup.
Learn more
amCharts & AI
How AI and amCharts work together — setup guides, knowledge base stats, featured projects, and everything you need to get started.
Pro Services
Can't find it?
We'll build it.Custom chart design and development from the people who wrote amCharts. We've built things that didn't exist before — new chart types, multi-layered dashboards, real-time telemetry systems, one-of-a-kind data stories.
If you can imagine it, we can build it. We like the hard problems.
Custom Chart Types
Need a visualization that doesn't exist yet? We design and build bespoke chart types tailored to your data.
Complex Dashboards
Multi-chart layouts with synchronized data, drill-downs, real-time updates, and pixel-perfect branding.
Deployment-ready Code
We deliver a functioning prototype, full source code, ready to be used in a real world application.
Start making your
data-viz LEGENDARY.$ npm install @amcharts/amcharts5
Also available via CDN and direct download.
pura: loading…
☰
📷 🔍 Discover ●▶ – ×
Ready
Close overlay
Hide for this session
Always hide on amcharts.com