rp2350 SWIFT
Cornell University ECE4760 Sliding Windowed Infinite Fourier Transform (SWIFT) Pi Pico RP2350
Page Organization: Contents The SWIFT algorithm to do a Fourier Transform was so new to me that I needed to build up intuition for how it worked and what it could do. The process invovled writing a description of the math followed by a series of programs.
- Math: The first section shows the math, and why using SWIFT instead of a FFT might be useful. SWIFT is related to the Sliding DFT, but uses an infinite exponential window, and is unconditionally stable.
- Verify Understanding: The next section is a rewrite of an earlier FFT speech spectrogram in which the FFT was swapped out and SWIFT swapped in, but using SWIFT parameters which reproduced the FFT results, and using the same graphics, audio input, and audio output. Ths was used as a check that I actually understood the math.
- Animate the complex resonator: At that point, I wrote a little graphics program which animated the behavior of five of the SWIFT frequency analysers, which are complex-valued resonators. This helped me visualize how adding a real input to a complex-valued phasor can result in frequency selective behavior.
- Setting parameters: Now I was ready to understand how the settable parameters for each resonator affected its frequency, bandwidth, and noise. The algorithm sets two time constants and the center frequency for each resonator frequency bin. The time constants control the duration and shape of the averaging window used to perfrom a weighted sum of the current and past inputs for each frequency bin. The bigger of the two time constants sets the exponential weighting function time. A bigger time constant implies narrower bandwidth, but longer settleing time. The shorter of the two time constants controls the response to a suddenly changing input. The longer time constant will usually be a small multiple, perhaps 1 to 10 times, of the period of the bin frequency. The shorter time constant will typically be a small fraction, say 5% to 20%, of the period of the bin frequency.
- Design Filter bank: Since each frequency resonator bin can be configured individually you need to figure out what a useful distribution of analysis frequencies is for your application. For speech, I chose a log-linear array of frequencies, with contant Q, so that the bandwidth of each bin is proportional to its bandwidth. I wrote a program which plots the measured response of an array of frequency bins on a VGA monitor.
- Phase vocoder: Finally we can write an application which uses an array of frequency bins to analyse speech into 48 bands, then used the complex spectrum to generate pitch-shifted speech using a simple phase-vocoder. The vocoder runs at 20 KHz sampling rate and supports pitch shift from 0.5 to 2.0 times the original voice frequencies.
- start/stop the DDS generator to check transients ddson or ddsoff
- set the decay time of the resonators dk rate\_const Where rate\_const is a integer between perhaps 50 and 1000 -- sets bin bandwidth Units of decay time is samples. See the next example for how to set decay time.
- set the five resonator frequencies. f center\_freq freq\_increment sets frequencies centered around center\_freq with spacing freq\_increment
- For a given frequency bin, the ratio of the FWHM to the frequency is set primarily by the ratio of the decay time constant to the period of the frequency.
- To produce an FFT-like frequency spectrum with equal bandwidth for each bin, set the decay times for each frequency to the same value.
- To produce a spectrum where the FWHM increases with frequency, set the decay time constant to a multiple of the period of the frequency. In filter terms, this is a constant Q filter bank.
- For low attenuation, the value of the slow decay time constant should be at least five times greater than the value of the fast rise time constant.
- DDS frequencies. dds value1 value2 \-- sets the frequency of each of the DDS inputs in Hz
- Rise time constant (fast) for the whole array of frequency bins. rise value \-- sets the fast rise time constant in samples To avoid attenuation of the peak response, the rise time should be short compared to the decay time. Keeping the rise time no greater the 0.2 of the fall time seems to be good.
- Fall time constant (slow) using one of two systems: * The fall time constant is the same for all frequencies and is specified by the user in samples. The actual performance depends on the sample rate, which for this program was fixed at 10ksamples/sec dk f value \-- sets the longer time constant (decay time) to a fixed number of samples Approximately: 0.5\* Fs/(decay\_samples)=FWHM bandwidth in Hz * The fall time constant is proportional to 1/F so that τ(ω)=(fall\_time\_ratio)\*Fs/F You set fall\_time\_ratio. A low fall\_time\_ratio means a larger FWHM. As the frequency increases, so does the bandwidth to maintain a constant Q. dk r value \-- sets the longer time constant (decay time) to a multiple of the dds period Approximately: 0.5\*frequency/(relative\_fall\_time\_ratio)=FWHM in Hz
- The frequency spacing of the frequency bins freq value \-- sets the frequency bin spacing in Hz Maximum value is 25 for a sample frequency of 10ksamples, and 200 frequency bins.
- The gain of the vertical scale of the plot gain value \-- sets the vertical size of spectrum
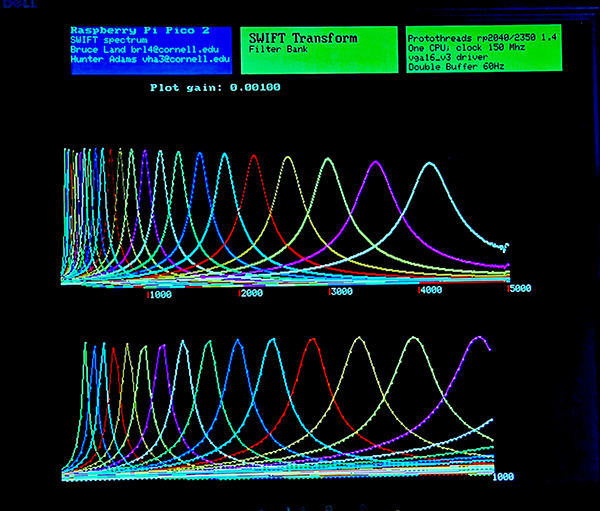
- A log-linear set of 24 filters distributed from 100 Hz to around 4200 Hz. As shown in the code, the F\[N\_FREQ\] array holds the bin center frequencies.
- The bandwidth of each filter is controlled by the decay time constant of the SWIFT algorithm. Here, the decay time was set to three times the period of the bin frequency. As shown in the code the dk\_rate\[\] array contains the bin decay rate, For the chosen frequency distribution, this decay time resulted in each bin response crossed the response of the next bin at around 50%. (see screen dump below)
- Since bins at higher frequency are wider, they must be smaller amplitude (Parsaval's theorum). To compensate, the gain of each bin was set to be proportional to frequency, normalized to 100 Hz. As shown in the code the gain\[\] array contains the bin gain relative to 100 Hz., This post-emphasis seemed to work with speech.
- The rise time was set to one sample to minimize higher frequency bin attenuation. As shown in the code the rise\_rate\[\] array contains the bin rise rate,
- All floating literals should end with f, Use for example a=1.0f.
- Never declare a double variable. Use float
- All float functions should use the single precision form. In this compiler for example, atan2 defaults to double precision and is MUCH slower. Use atan2f.
- T_he ISR timing will fail if any double precision is used_
SWIFT algorithm. The SWIFT algorithm is a Fourier transform technique which updates the transform at every input sample time, rather than computing a transform on a block of samples, like the FFT. SWIFT also uses an exponentially weighted window, and hence has an infinitely wide window, unlike the finite window of the FFT. These features have several very handy consequences:
1. The latency for an updated spectrum is one sample, hence completely real-time. An exponential window gives more weight to recent data. 2. You only have to transform the frequences you need. You do not need to produce a full spectrum, although you can. 3. Since the window is infinite, frequencies are not at fixed spacing like the FFT. Place the frequencies on a log scale, linear scale, or randomly 4. There is a bandwidth parameter for each transform frequency bin you want to compute. Setting the time-constant higher makes the bandwidth narrower. Of course, time/bandwidth limits mean that very narrow frequency bins may converge slowly.
Each transform frequency bin, at frequency ω, is computed as a damped, complex resonator, with a real input. The estimate of the frequency bin amplitude at time n is Xn(ω) which is, of course, a complex value. Xn(ω) is computed iteratively from the n-1 time step estimate by slightly decaying the complex amplitude toward zero, advancing the phase by one time step, then adding the real input sample.
Xn(ω) = e(-1/τ) × e(jω) × Xn-1(ω) + xn
The units of ω are radians per sample time, ω=2\*π\*F/Fs. Fs is the sample rate and F is the frequency of the transform bin in Hz.
The decay time constant, τ, has units of number of samples. The time constant determines the bandwidth of the bin. Bigger time constant means narrower bandwidth. Typical values might range from 20 to 100, but could be different for each frequency bin. For speech, τ(ω)=3\*Fs/F seems to work well.
Since both τ and ω are constants, the exponentials can be computed once and stored in a table. The real-time computation reduces to one complex multiply and one real add per sample. The transform noise level can be significantly lowered with a better window consisting of two exponentials. This doubles the arithmetic. In the paper linked above this is refered to as the α-SWIFT version, which is what I actually implemented. The α-SWIFT algorithm is:
Xn(ω)α = Xn(ω)slow - Xn(ω)fast
The only difference between the fast and slow spectral estimates is the value of τ Where τslow \> τfast \> 0. The fast time constant is set to a few samples. The slow time constant is set as above. The overall effect of the two time constants is to reduce spectral leakage by removing the discontinuity in the window when new samples are added.
---
Example of speech analysis and re-synthesis. The speech example runs at a sample rate of 10,000 samples/sec. Most of the energy in speech is below 4 KHz, and above \~100 Hz. For testing I transformed the signal into 200 bins from 0 to 4 KHz, with 20 Hz bin spacing. The resulting spectrum, log spectrum and spectrogram was displayed on the VGA. The spectrogram time slice is around 20 milliseconds.
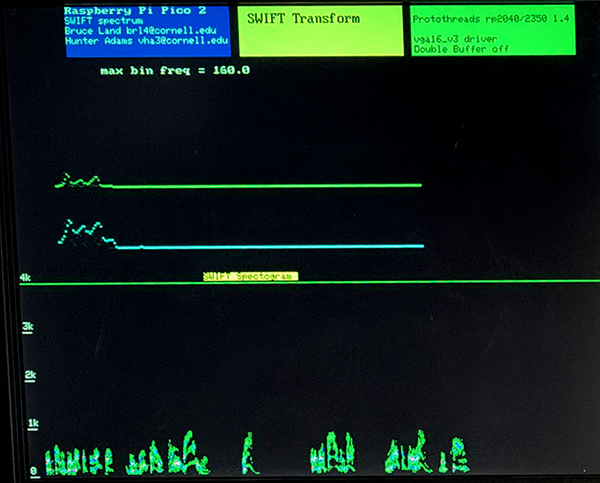
The signal is high-passed at around one Hz to remove residual DC offset. Input comes from a line-level output from a computer. Since the spectral estimate of each frequency is computed as a time-varying phasor, a reconstruction of the original signal was made by summing the time-varying real parts of all the frequency bins and feeding the scaled result to a DAC. This is just a audio loop-back to show everything is working. The sampling ISR, which computes the α-SWIFT and the inverse uses about 0.6 of one cpu at 150 MHz.
---
Animation of SWIFT algorithm SWIFT computes the Fourier transform for each frequency separately, just as the DFT does. Unlike the DFT, the correlation between the complex frequency and the input is computed sample-by-sample, with a exponentially decreasing weight for older samples. One way to think of this is to consider the current transform estimate for a given frequency to be a slowly-decaying phasor rotating at that frequency. The next input real-valued sample is just added to the phasor at whatever the phasor's current phase happens to be. The video below shows an input sine wave with frequency of 0.02 radians/time step applied to five complex phasor resonators. The phasor is shown as a rotating white line. The real input is shown as a horizontal yellow line oscillating left-right. The output waveform is the real part of the phasor polotted vs time. You can see that the output of the center phasor becomes much greater than the other because the input freqeucy is always leading the phasor, and therefore driving it to higher amplitude.
This scheme requires about eight real adds and eight real multiplies per computed transform frequency, per time sample. It is thus less efficient in terms of cycles compared to FFT, but has several advantages. The main advantage is that it is completely real-time, so there are no FFT block artifacts resulting from artificial block boundaries. Another advantage is that the bandwidth of each trasformed frequency can be set to a different bandwidth, unlike the FFT which is constrained by the number of points in a block and the block duration. The time constant of the exponential weighting function sets the bandwidth. Longer time constant means narrower bandwidth, the usual time/frequency tradoff. Also, since the exponential window is infinite, the values of the transform frequencies are not quantized. The FFT frequency increment is fixed at the reciprocal of the block duration.
The program has a double-buffered animation thread and a serial thread. The serial thread recognizes several commands to control the graphics display. There are commands to
---
Investigating the decay-time vs bandwidth tradeoff. The bandwidth of each transformed frequency can be set to a different bandwidth, by setting the time constant of the exponential weighting function. Generally, a longer time constant means narrower bandwidth. But to get more specific, let's define bandwidth as the Full-Width-Half\_Maximum (FWHM) of a given frequency peak, where FWHM means the width of the peak in Hz, at half its maximum amplitude. For the α-SWIFT version, the relevant parameters which determine the bandwidth are the frequency of the peak, the time constant of the exponential decay (slow time constant), and the time constant of the exponential rise function (fast time constant).
The observations are:
Bandwidth program The bandwidth testing program allows you to enter the relevant parameters for an array of frequency bins, then measures the FWHM for two test frequencies set by a pair of direct digital synthesis (DDS) input sinewaves. Using serial input you can set:
The top half of the screen displays the amplitude spectrum. The bottom half displays the various input parameters and the resulting FWHM for each peak. The first image shows a fixed decay time of 100 samples. Each frequency bin has the same fairly narrow bandwidth, like you would get with a DFT. The second image shows a relative decay time set to 10 times the period of each different frequency. The bandwidth scales with frequency, like you would get with constant Q filters. As the FWHM gets larger, the peak has to drop to satisfy Parseval's theorum.


---
Designing a Filter Bank The previous example shows how to design the filter response of a uniformly spaced array of resonators (frequency bins). Most real examples need finer control of each bin. For example speech analysis typically uses frequency bins which are distributed along the frequency axis at log-linear intervals. Each bin can have a different bandwidth and gain, and may need control of the rise time constant. There are so many combinations of layouts and parameters that the filter bank must be defined by changing a small section of the program. My speech code specifies:
The top trace runs from 0 to Nyquist frequency of 5 KHz. The bottom trace just expands out the part from 0 to 1000 Hz.
---
Using SWIFT to build a speech phase-vocoder A phase vocoder is used to pitch-shift speech or to change speech rate. The SWIFT algorithm can be used to extract the amplitude/phase spectrum of a speech signal. The phase spectrum is used to set the frequency of a multichannel DDS synthesizer, and the amplitude spectrum sets the gain of each DDS channel. The phase difference between two successive samples for a given frequency analysis bin yields the instantaneous frequency content of the bin. This phase change is then Euler integrated to give a phase value that can act as the index into a DDS sinewave lookup table. The sum of the sinewaves from each bin, weighted by the amplitude spectrum, becomes the output signal. If you scale the phase change by a constant near one, then you pitch-shift the output. Practically speaking, the useful pitch shift range is about 0.5<shift-value<2.0. Lower shifts become subsonic and hard to hear. HIgher shifts will start to alias. Both extremes seem to limit intelligibilty.
This example does a settable pitch shift. The 48 bin SWIFT analysis is running in a ISR at 20 KSamples/sec. The same ISR is also computing the instantaneous frequency of each bin output. This may not be the same as the bin center frequency because of the relatively wide bandwidth of each bin. The phase difference between consecutive samples of each bin output is an estimate of the first derivitive of the phase, which is the current frequency. This phase derivitive may be scaled to shift the frequency, and is then fed into an numerical integrator to get the phase for a direct-digital-synthesis (DDS) sine wave generator. The sum of the sine outputs from the 48 DDS units is the vocoder output.
The 48 bins are equally spaced by a frequency ratio of 1.085 from 90 Hz to about 4300 Hz. This range captures most of the energy in human speech. The bandwidth of each bin is set to overlap the next bin at around 40% of peak. The gain of each bin drops somewhat at lower frequency. Every parameter can be modified if you don't like the sound. The filter bank program above was used to design the vocoder bins
Sound Samples: Original voice sample from an old lecture. Shifted down to 0.8 of original pitch. Shifted up to 1.4 of original pitch
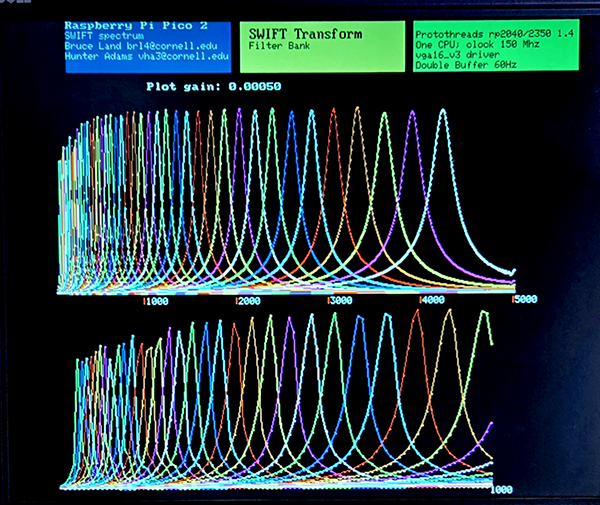
The program is organized as two threads running on one core, and one ISR running of the other core. One thread precomputes and stores all of the complex constants necessary for efficient arithmetic in the ISR. The other thread is a simple serial interface to a terminal emulator used to set the pitch shift. For each sample time, the ISR:
1. computes the alpha-SWIFT estimate of the phase and magnitude for each of 48 transform frequency bins. 2. uses a fast approximation to get the current magnitude of the bin. See Alpha Max, Beta Min Algorithm, the +/- 2% version near the bottom of the page 3. uses atan2f to extract the phase of the bin, then subtracts the previous phase for that bin to get an estimate of the instantaneous frequency. The atan2f function takes one half of the execution time of the entire ISR 4. Euler integrates the phase difference to product a phase, which is used to index into a precomputed sine table. 5. scales the sine table output by the previously computed bin magnitude. 6. adds all 48 scaled sine waves together to form the output sample. 7. sends the output sample to an SPI DAC.
The rp2350 has single precision float hardware. Double precision is slow because the operations are emulated in hardware/software. For speed sensitive routines, it is important to remind the C compiler that you want single precision floating point:
---
Copyright Cornell University July 22, 2026