



Measuring ship traffic in the Strait of Hormuz, and what it did to refining margins
8 Mins Read
19 Aug 2026
Measuring ship traffic in the Strait of Hormuz, and what it did to refining margins
Authors
- Jia Yu
- Damian Wylie
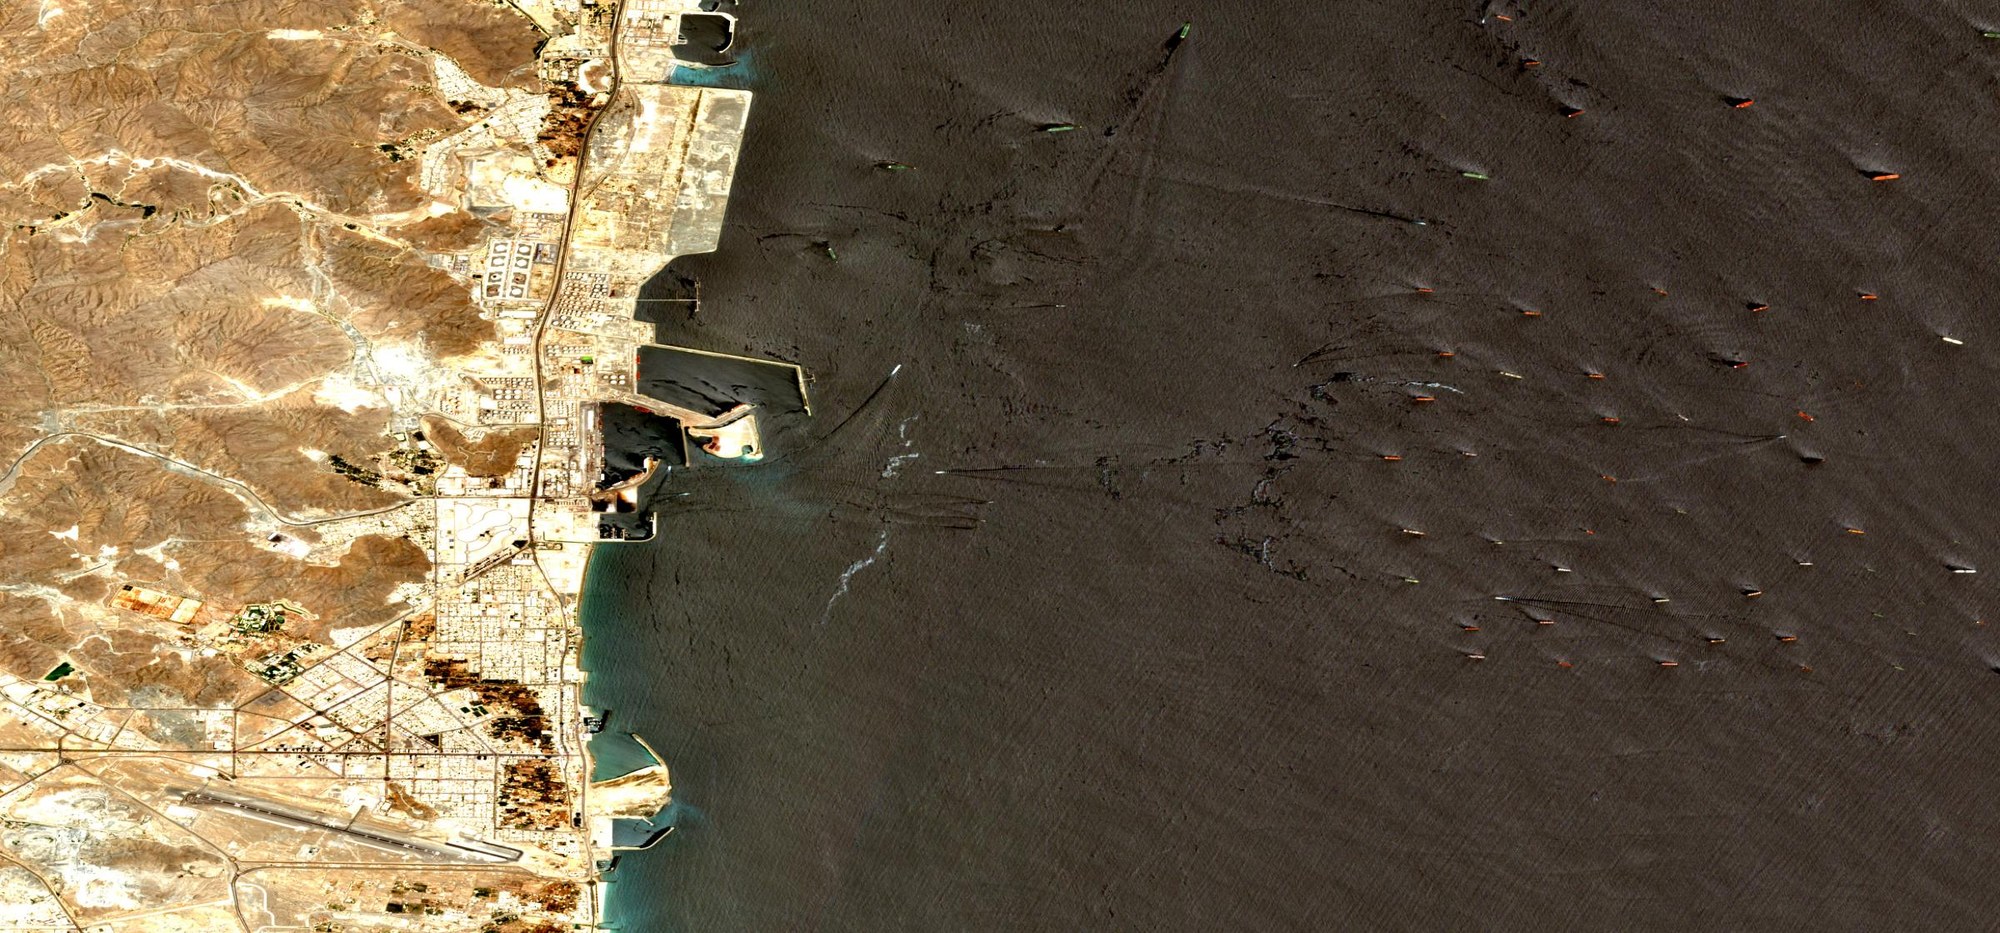
Iran closed the Strait of Hormuz to commercial shipping on 28 February 2026. To find out what stopped moving, we counted ships in free satellite imagery, month by month, from January 2025 through August 2026. Traffic through the corridor we watched fell 95%. Tankers kept loading at Iran’s Kharg Island terminal and kept waiting at anchor off Fujairah, both at 2025 levels, which means the crude was still being pumped and the ships were still turning up. Only the route between them went quiet.
Refining margins more than doubled after the closure and have stayed there. Consumers are paying the increase at the pump. The vessel count used a near-infrared threshold rather than a trained model. Sentinel-2 imagery is free and covers the planet every five days, and the whole analysis ran as one Python job in Wherobots for about $63 of compute.
What the satellites saw
We counted vessel hulls in Sentinel-2 imagery over three areas from January 2025 to August 2026. Comparing May to July in each year, so the summer sun sits at the same angle in both:
| Hormuz transit corridor | 10.3 vessels | 0.5 | −95% | | --------------------------------------------- | ------------ | ---- | -------- | | Fujairah anchorage, outside the strait | 63.5 | 70.0 | +10% | | Kharg Island export terminal, inside the Gulf | 7.3 | 9.9 | +35% |
Those figures are per satellite pass, averaged over the passes clear enough to see the whole box.
We used imagery because the usual source cannot be trusted here. Ship traffic is normally tracked through AIS, the transponder every large vessel carries. In this crisis those transponders are being switched off and falsified. Near Fujairah and Khor Fakkan, roughly 470 vessels broadcast garbled or impossible positions inside a single 24-hour window. Windward counted 146 of 167 vessels in the strait area running dark on 5 May, and IMF PortWatch warns that its own numbers understate traffic for the same reason. Optical imagery records the hull whether or not the transponder is on.
What it did to refining margins
Brent ran from $72.75 before the closure to a peak of $138.21 on 7 April, then fell back to $93.26 by mid-August. Refining margins stayed elevated.
The 3-2-1 crack spread measures what a refiner earns turning three barrels of crude into two of gasoline and one of distillate, and it is the refining share of what a fuel costs. Measured against Brent, it averaged $18.17 a barrel through 2025 and held at $18.50 in the weeks before the closure. Since then it has run at $42.72, with a peak of $68.70 on 16 July.
US retail gasoline has gone from $2.94 before the closure to a national average of $4.07 this week, up 30% year on year. Diesel costs 48% more than a year ago and jet fuel more than 70%, and higher diesel alone has cost American consumers close to $40 billion since the war started, according to Brown University’s Climate Solutions Lab.

Vessel detections per satellite pass across the three areas, with Brent crude, the 3-2-1 refining margin and the US pump price on the same timeline.
Refiner stocks reflect those margins. Marathon Petroleum and Valero shares have more than doubled this year, Phillips 66 is up almost 90%, and ExxonMobil earned $160 million a day last quarter. The diesel crack spread hit $102 a barrel on Monday, an all-time record.
Three disruptions are constraining refining capacity at once: the Hormuz closure, Ukrainian drone strikes that have taken roughly 40% of Russian refining capacity offline, and Chinese cuts to fuel exports to protect domestic supply. Satellite imagery identifies where traffic fell without relying on AIS broadcasts.
How to count ships from space
Water absorbs almost all near-infrared light, so in Sentinel-2’s B08 band the sea is nearly black. Painted steel reflects it strongly. Over the Fujairah anchorage on 7 August 2026 the water sat at 0.09 reflectance and the brightest pixel in the box read 0.87, so a vessel stands out by a wide margin and no machine-learning model is needed to find one.
Wherobots queries the Sentinel-2 files directly in the public archive. The `raster` data source opens each scene in place and fetches only the pixels a query touches. Asking for one 20 km box out of a 110 km scene reads roughly 4% of the file, and nothing is written to disk.
The code below is excerpted from the job script. Setup lines, the scene list and the tuning constants are left out to keep each step readable. The whole pipeline is available as a runnable notebook that opens in Wherobots Cloud, with every constant in one cell so you can point it at your own area.
Show the code
AOI = ("POLYGON((56.42 25.10, 56.62 25.10, 56.62 25.30, "
"56.42 25.30, 56.42 25.10))")
AOI_SQL = f"ST_SetSRID(ST_GeomFromWKT('{AOI}'), 4326)"(sedona.read.format("raster")
.option("tileWidth", "512").option("tileHeight", "512")
.option("autoRescale", "true") # off by default: without it you get raw DN
.load(paths)
.createOrReplaceTempView("tiles"))
Background statistics on water only. The median centre ignores a bright
minority of pixels. Pooling the per-tile standard deviations by their median
discards a tile spoiled by cloud or land, but bright pixels inside a tile
still inflate that tile's spread, so a crowded anchorage lifts the cutoff
somewhat. That bias is conservative and falls on both years alike.
r = sedona.sql(f"""
WITH s AS (
SELECT zs.median AS med, zs.stddev AS sd
FROM (SELECT RS_ZonalStatsAll(rast, {WATER_G}) AS zs FROM tiles)
WHERE zs.count > 0
)
SELECT percentile_approx(med, 0.5) AS med, percentile_approx(sd, 0.5) AS sd
FROM s
""").collect()[0]threshold = r["med"] + max(SIGMA_K * r["sd"], 0.03)
2026-08-07  cov=100.0% cloud= 2.67%  med=0.0915 sd=0.0097 thr=0.1687  \
brightpx=   5636  vessels=  84  >=200m= 39
`RS_ZonalStatsAll` reports statistics for the pixels inside a shape. Using the median prevents a small number of bright pixels from raising the threshold; an average would be pulled upward by every ship in the frame. Adding a multiple of the spread gives a cutoff for that scene. The spread is pooled the same way, by taking the median of each tile’s standard deviation, which discards a tile spoiled by cloud. It is only a partial defence: ships inside a tile raise that tile’s spread, and with it the cutoff, so the count runs slightly conservative in a crowded anchorage. The sea is brighter in July than in January, so the cutoff has to move with it.
A short Python function applies that cutoff, and `RS_Polygonize` traces the outline of every bright patch.
Show the code
@sedona_vectorized_udf(return_type=RasterType())
def threshold_udf(rast: SedonaRaster) -> SedonaRaster:
    a = rast.as_numpy_masked()[0]
    out = np.zeros(a.shape, dtype=np.float64)
    with np.errstate(invalid="ignore"):
        out[np.isfinite(a) & (a >= threshold)] = 1.0
    return rast.with_bands(out[np.newaxis])with_bands() needs real pixels; the reader returns out-db references.
(sedona.sql("SELECT RS_AsInDB(rast) AS rast FROM tiles")
    .withColumn("mask", threshold_udf("rast"))
    .createOrReplaceTempView("masked"))RS_Polygonize returns every connected region in ONE array, so running it on a
whole scene OOMs an executor -- per tile it is cheap and parallel.
sedona.sql(f"""
    SELECT t.p.geom AS g
    FROM masked LATERAL VIEW explode(RS_Polygonize(mask, 1)) t AS p
    WHERE t.p.value = 1.0
      AND ST_Area(t.p.geom) BETWEEN 2000 AND 200000
""").createOrReplaceTempView("raw_blobs")A vessel lying on a tile seam is polygonized twice, once either side of the
cut. Union everything, then split it back apart: the halves become one
polygon, while vessels that never touched stay separate. The area floor above
runs before this merge, which has a cost the last section spells out.
sedona.sql("""
    WITH dissolved AS (
        SELECT explode(ST_Dump(ST_Union_Aggr(ST_MakeValid(g)))) AS g
        FROM raw_blobs
    ),
    sized AS (
        SELECT g, ST_Area(g) AS area_m2,
               2 * ST_MinimumBoundingRadius(g).radius AS length_m,
               ST_MinimumWidth(g) AS width_m
        FROM dissolved
        WHERE ST_Area(g) BETWEEN 2000 AND 200000
    )
    SELECT g AS geometry, area_m2, length_m, width_m
    FROM sized
    WHERE width_m >= 20
      AND length_m / width_m BETWEEN 2 AND 15
""").createOrReplaceTempView("candidates")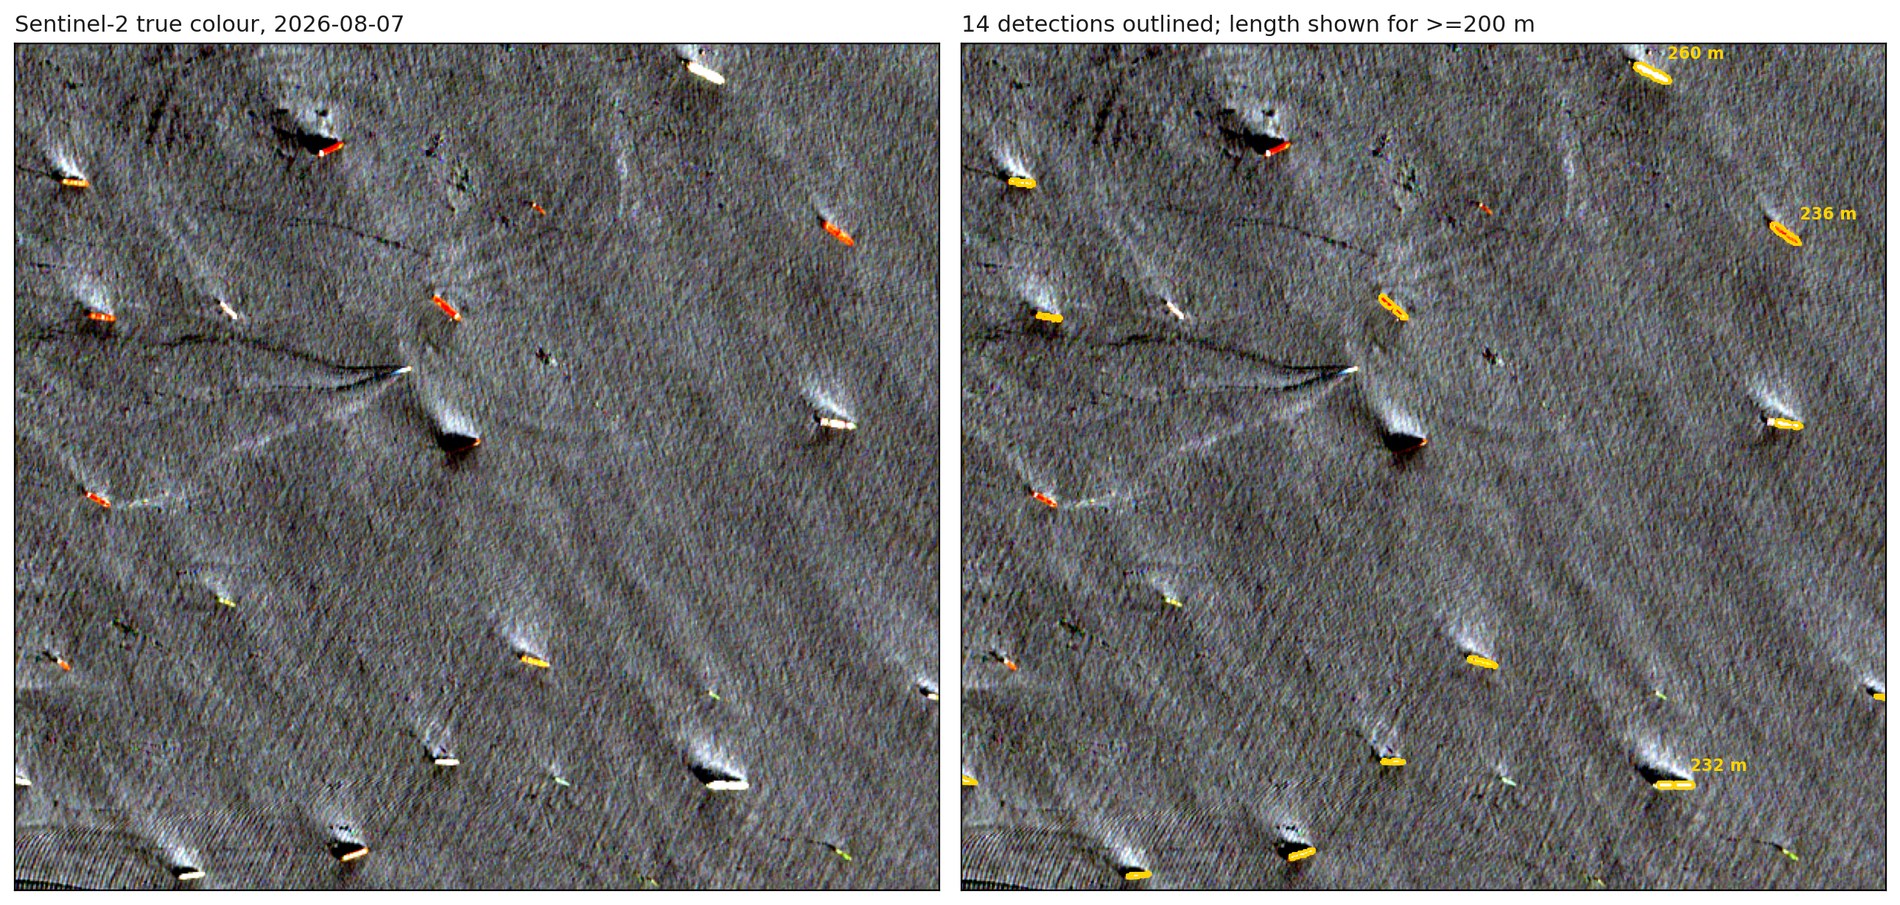
Sentinel-2 true colour over the Fujairah anchorage on 7 August 2026. The same pixels appear on both sides, with detected vessels outlined on the right and lengths marked for those over 200 m. A detected 280 m hull covers about 12,600 m², which is roughly two football pitches and matches the deck of a Suezmax tanker.
Ruling out rocks, land and glint
Rocky islets also reflect near-infrared light. The Quoin Islands sit directly in the shipping lane, and in an early run three of our first four detections turned out to be those rocks.
Wherobots holds imagery and map data in one engine, so checking detections against an independent source takes one query. Overture Maps publishes global land polygons. They already sit in the Wherobots open data catalog, and one join drops any detection that touches land.
Show the code
sedona.sql(f"""
    SELECT ST_Buffer(ST_Transform(geometry, 'EPSG:4326', 'EPSG:{epsg}'), 60) AS g
    FROM wherobots_open_data.overture_maps_foundation.base_land
    WHERE ST_Intersects(geometry, {AOI_SQL})
""").createOrReplaceTempView("land")detections = sedona.sql("""
    SELECT d.geometry, d.area_m2, d.length_m
    FROM candidates d
    LEFT ANTI JOIN land l ON ST_Intersects(d.geometry, l.g)
""")
Two further checks run alongside it. Sun glint can brighten patches of open water, so we keep only detections shaped like ships, which filters out glint using the near-infrared band alone. A hull is typically four to eight times longer than it is wide and a glint patch is round, so the filter accepts anything between 2:1 and 15:1 and at least 20 m across. Those bounds are deliberately loose, wide enough that an unusual hull still passes while a round blob cannot. And a satellite pass sometimes catches only part of a box, so any date where less than 95% of the area was photographed is dropped. Counting a partly-seen box would look like a decline in traffic that never happened. In practice nothing landed in between: every date behind the figures came in at 100% coverage, and the rest were dropped outright.
A study fusing Sentinel-1 radar with AIS measured a 97% decline across the two weeks either side of the closure. We measured 95% from optical imagery over a longer window, with no AIS involved.
Every vessel we found
The job writes its detections as GeoParquet and then as PMTiles, a single file a browser can read directly from cloud storage without a tile server. Each month becomes its own layer, so a before-and-after comparison means publishing the two months that matter.
Show the code
from wherobots import vtilesfeats = sedona.sql("""
SELECT geometry, aoi, obs_date, length_m, area_m2, capacity_bbl,
date_format(to_date(obs_date), 'yyyy-MM') AS layer
FROM det
""")
vtiles.generate_pmtiles(feats, f"{base}/hormuz_monthly.pmtiles")
The three maps below show one area each, with the 2025 month in blue and the 2026 month in red. Each caption gives the month’s total and a per-pass rate, which divides that total by the number of usable passes.
The corridor. May 2025 in blue against May 2026 in red. 46 detections across four clear passes in 2025, then two across one pass: about 11 vessels a pass, down to two. Open fullscreen.
The anchorage outside. April 2025 in blue against April 2026 in red. 200 detections over three passes, then 122 over two, which is roughly 67 a pass and then 61. April appears here because no May 2026 pass covered the box. Open fullscreen.
The loading terminal inside the Gulf, May 2025 in blue against May 2026 in red. Loading held: 22 detections over two passes in 2025 and 29 over three in 2026, or 11 a pass then about 10. Open fullscreen.
All three areas at once, with every month switched on: 3,117 detections in 20 layers, one per month from January 2025 to August 2026. Kharg sits to the north-west, the strait and Fujairah to the south-east. Step through the months in the sidebar to see the corridor empty while the anchorage and the terminal keep their traffic. Open fullscreen.
Compute cost and data read
719 Sentinel-2 scenes cross these three areas over 20 months, which is 151 GB of imagery. The analysis read about 1.5 GB of that, because `RS_Clip` fetches only the parts of each file that overlap the boxes we care about. The scenes stay in the public archive throughout.
The 20-month run took 26.8 minutes on a MEDIUM runtime, roughly 25 Spatial Units at $1.50 each in us-west-2, or about $37. Widening the same job to the whole Gulf of Oman and lower Persian Gulf, 368,875 km² at full coverage, added $23 and seven minutes of wall clock. Calibration and tiling took it to about $63. Wherobots Cloud reports the exact figure for every run in Workload History.
The coordinates and date range are parameters, so pointing the job at another chokepoint is an edit to two arguments. The notebook has them in the first cell, alongside the size and shape gates. Sentinel-2 passes overhead every five days, and a scheduled run keeps the count current independent of AIS broadcasts.
The surveyed corridor is 25 km wide within a strait roughly 40 km across. The analysis shows a 95% decline within that corridor. It cannot determine whether some vessels shifted to routes outside the box. A second limit sits in the detector: the 2,000 m² floor runs before the seam merge, so a small hull lying on a tile boundary can split into two pieces that each fall under the floor and never get counted. A hull touches a seam on roughly 2% of passes, the loss only bites near the size floor, and it falls on every date equally, so the comparisons survive it. The downloadable notebook moves the real gate after the merge.
 10 Mins Read 11 Aug 2026 From the Spokane firestorm to all of Washington: real-time wildfire monitoring for under $50 a pass The moment a satellite pass lands, this pipeline turns it into a burn-severity map in 14 minutes: real-time wildfire monitoring with Python and Spatial SQL that protects lives and assets, shown on the Spokane firestorm and scaled to the entire state of Washington.
[  3 Mins Read 5 Aug 2026 Wherobots Now Federates with the AWS Glue Data Catalog AWS customers can now bring Wherobots’ best-in-class spatial intelligence capabilities to any dataset managed by AWS Glue Data Catalog. AWS Glue Data Catalog (GDC) customers use it to manage structured data, like user activity and revenue reports, and complex geospatial data, like parcels, buildings, and mobility datasets. AWS services like EMR, Redshift, and Athena excel \[…\] ](https://wherobots.com/blog/aws-glue-data-catalog-spatial-workloads/)
[  7 Mins Read 8 Jul 2026 How Bad Telemetry Data Sabotages Modern Fleets By the Teams at Action Engine & Wherobots Fleet monitoring is undergoing a generational shift. Fleet monitoring, the systems that ingest and analyze vehicle telemetry to track fleet health, performance, and safety, has become the foundation of how operators run vehicles, not just track them. Modern vehicles generate orders of magnitude more telemetry than even \[…\] ](https://wherobots.com/blog/bad-telemetry-data-fleet-observability/)
Awesome that you’d like to share our articles. Where would you like to share it to: